
HOT-Philippines completes remote mapping and validation for Pampanga
Posted by feyeandal on 1 October 2020 in English.As of 21 September, the mapping and validation tasks for the campaign #PhilAWARE - #MAPampanga in the Tasking Manager have been officially completed. Quezon City and Pampanga are the two pilot areas for the #PhilAWARE project. Quezon City tasks were also completed on June 2020, as part of the #endcov initiative of HOT-PH and UP Resilience Institute.
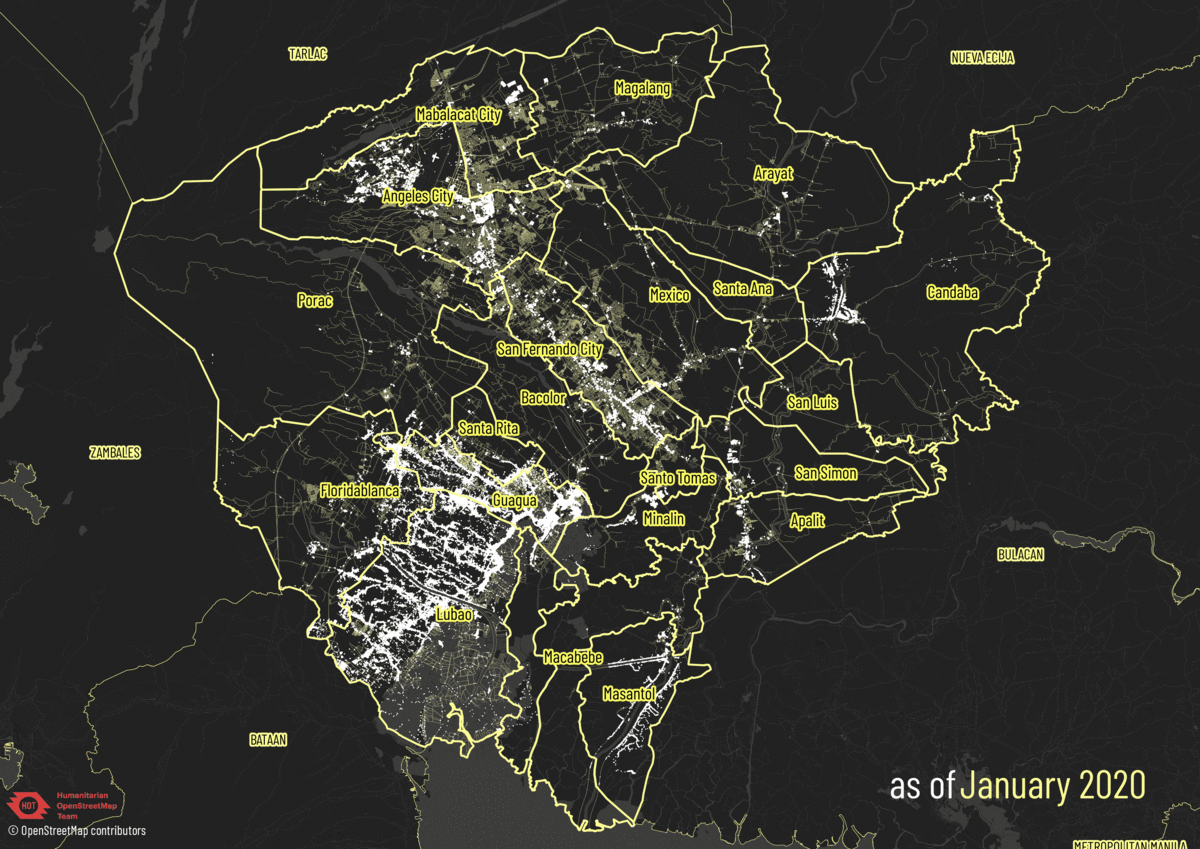 OSM building footprints and roads in Pampanga from January to September 2020
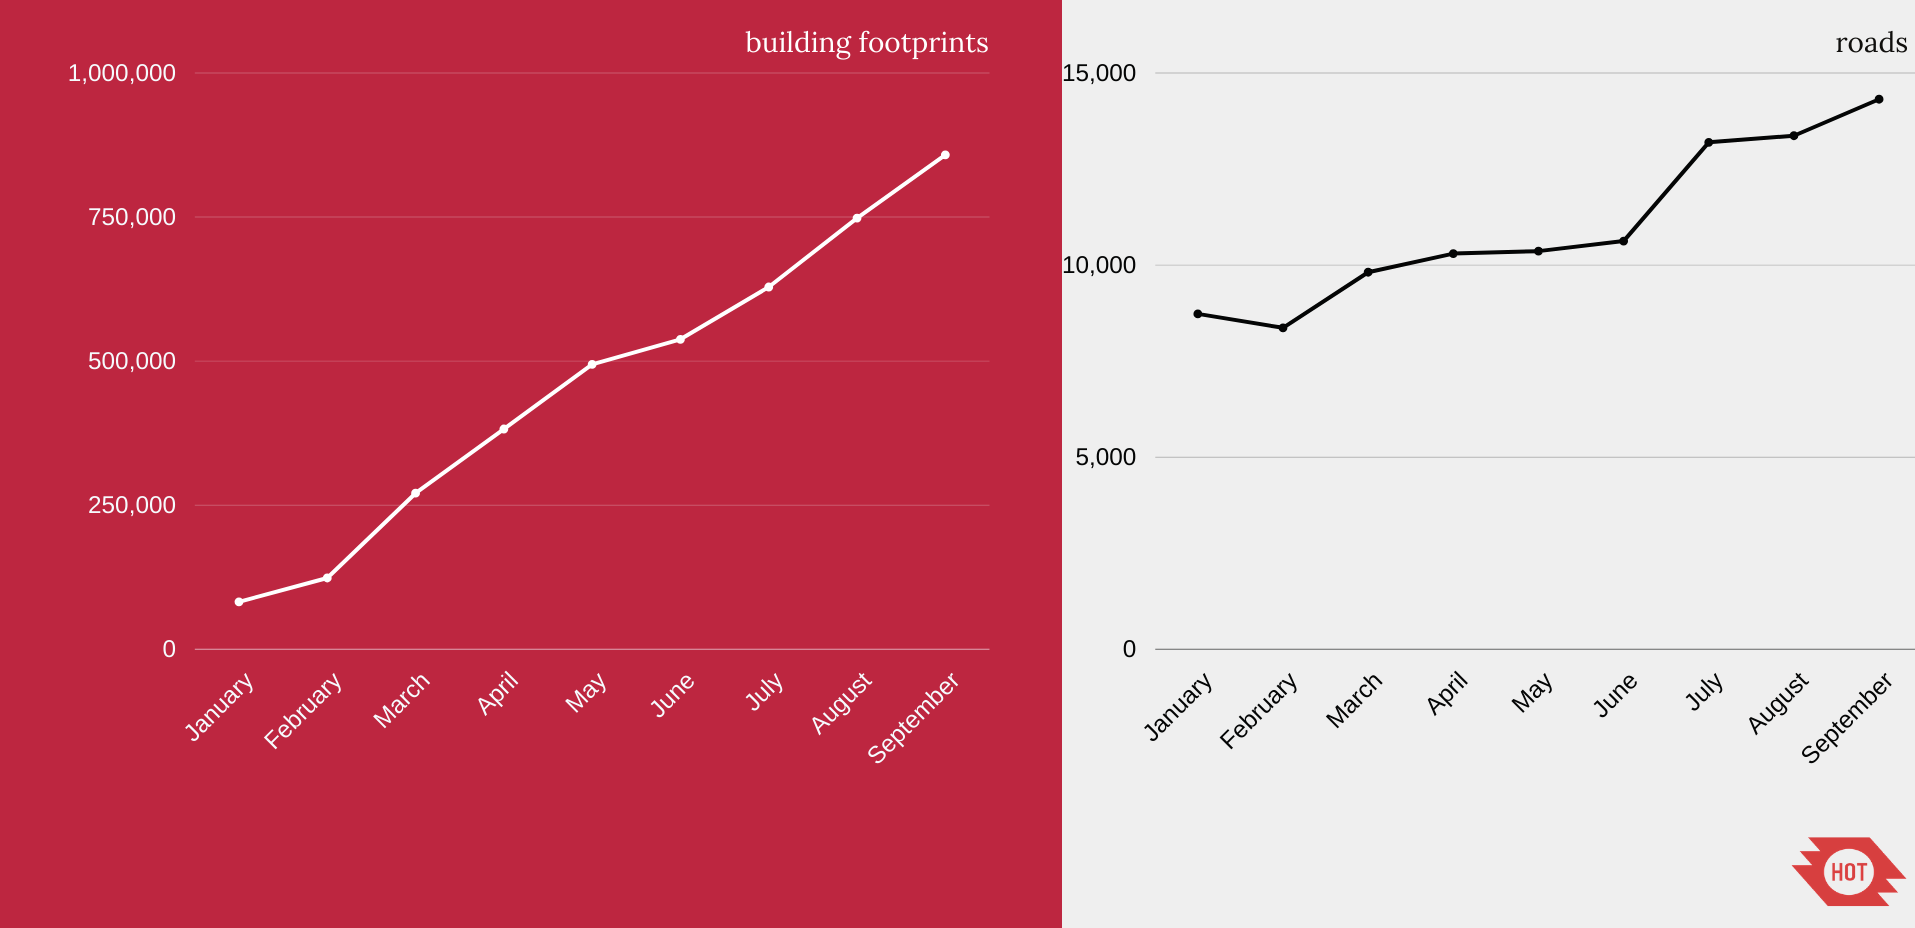 Building footprint count and road length (in sq.km.) in Pampanga from January to September 2020
The #MAPampanga remote mapping activities started last February 2020, days before the #MAPampanga event held at Thinking Machines Data Science office in Taguig City. The completion of the projects in the Tasking Manager was made possible through the help of several organizations and individuals. We conducted series of in-person and online mapathons with various student organizations and corporate partners, government agencies, and the general public to engage with more volunteers and build quality mappers.
There has been an increase of ~933.41% in the building count while ~63.99% in the road length through the #MAPampanga mapping initiatives. A total number of 1,754 unique contributors has also been recorded.
Prior to the HOT Philippines activities in Pampanga, OSM Philippines and the local government units of Pampanga (Guagua, Lubao, and Candaba) have been contributing to improving their map in OpenStreetMap.
While the remote mapping and validation tasks have been concluded, we still have a long way to go. The HOT-PH Field Mapping Team based in Pampanga started the field mapping operations last August for the municipalities in Pampanga to collect critical lifeline infrastructures data. Aside from field mapping, the HOT-PH Training Team also started training and building the capacity of the local government units and volunteers on using OpenStreetMap.
We would like to thank everyone who contributed to #MAPampanga and #PhilAWARE!
Discussion
Comment from Mig_Imperial on 9 October 2020 at 07:49
Hello Ms Vicario. I’m new to OSM. Congratulations to the success of your team’s project!I have some questions po, mainly about the tracking OSM contribution.
How did you make the GIF of the OSM footprint per month? I’m thinking I manually download it per month, style it, and put into a GIF maker.
“The HOT-PH Field Mapping Team based in Pampanga started the field mapping operations last August for the municipalities in Pampanga to collect critical lifeline infrastructures data.”
Is there a list of active “Mapping Teams” in the Philippines? maybe there’s one in Camarines Sur, Bicol.
For building count, am I correct that you counted it by simply counting the features in the shapefile?
Thank you!
Comment from feyeandal on 9 October 2020 at 07:54
Hello @Mig_Imperial! This is Feye Andal, not Faye Vicario :p Anyway, welcome to the OSM community!
To answer your questions: 1./ Yes, I downloaded the building footprints in the Philippines per month using geofabrik.de and cut it to Pampanga province, style it, then generate all these static maps to an animated map using an online GIF converter. 2./ Do you mean OSM mapping teams in the Philippines? If that’s what you are referring to, the active mapping teams in the OSMPH community are MapBeks, GeoLadies, Mental Health AWHEREness, and various local chapters of the YouthMappers network. 3./ For the building count, yes, I simply counted the building footprints per month.
Thank you, Migs!