OpenStreetMap logo OpenStreetMap

Minh Nguyen's Diary

Recent diary entries

surface=keys;values

Posted by Minh Nguyen on 13 February 2024 in English.

This week’s weeklyOSM #707 wonders aloud whether Flørauden is the most heavily tagged node in OSM. Why wonder when OSM query engines like QLever can tell us for certain?

In fact, at a mere 283 tags, this lighthouse is a featherweight compared to the top ten nodes, which are all place=country nodes weighed down by linguistic and diplomatic considerations. The most heavily tagged node of any kind has a well-known name, alt_name, official_name, and old_name in many languages.

Excluding place=country, most of the top ten nodes are place=city and place=continent nodes. But the node in sixth place caught my attention: some 250 tags on a children’s clothing store, mostly about payment methods. One is only left to wonder if a customer, paralyzed by all the options, may resort to bartering. This vandalism was removed three weeks ago, but QLever hasn’t updated to a newer Turtle extract that contains the fix.

Excluding all place=* nodes, the now payment-ambiguous clothing store, and a duplicate Sri Lanka node that was accidentally stripped of its place=country tag (now fixed)… the other most heavily tagged nodes are all seamarks – lighthouses and lighted beacons.

Flørauden was 16th among seamarks until it shot up to the top a couple weeks ago. Now, with 27 different seamark:light objects tagged on it, no other seamark comes close to it in the number of seamark:light:* subkeys.

This lighthouse may not set a record, but it does illustrate why the seamark tagging scheme unusually relies on numbered subkeys instead of parallel semicolon-delimited tags. The street parking tagging scheme used to do something similar before we simplified it a couple years ago, but back then, even a notoriously well-signposted street could only muster a puny 60 tags.

Now all we need is for Null Island to become a seamark, island nation, and international security incident.

Location: 0.000, 0.000

Pushing the chair in

Posted by Minh Nguyen on 20 February 2023 in English.

If you’re a member of OpenStreetMap U.S., check your inbox and vote in this year’s election for the open seats on the board of directors. There are some familiar names and some new ones, but each of them is well-qualified and eager to serve the community. For the first time in a while, you won’t see my name on there. After four straight years on the board, I’m wrapping things up and stepping aside to let those with fresh energy take the organization forward from here.

Four years ago, when I first ran, the organization had just hired Maggie as our new executive director. We were still transitioning from years of depending on an all-volunteer board to keep the lights on. Putting an on annual conference was enough to keep our hands full. Formal partnerships with other organizations were still a ways off. Did anyone notice we hadn’t officially become a local chapter yet?

© 2016 Tatiana Van Campenhout, CC BY 2.0

Things were just picking up for the U.S. community, too. We were beginning to experiment with regular online meetings.1 A proof of concept for a shield-capable renderer was lying around somewhere, waiting for the right people and the right opportunity to turn the idea into a sustainable project. The Slack workspace had only a hundred different channels to keep up with.

OSMUS has made progress as a team in many areas. The staff has been remarkably good at prioritizing all the handwaving from this naïve board member. Our partners have shared perspective and resources that helped us make it look easy. The community has had our back and kept us honest, and we really do appreciate your participation in working groups and social events.

Whenever we think we’re settling into a routine, that we know what we’re doing, something comes along to jolt us out of our complacency. Robust debates on the lists revisited long-held assumptions about how we classify things. COVID reminded us we don’t want to live in isolation. Social justice movements gave us new reasons for documenting the world together.

© 2020 Christopher Michel, CC BY 2.0

Change is easier to stomach when you have a purpose that transcends the tagging controversy du jour. OSM does. Every year, I felt obligated to write a distinct position statement when running for reelection. But I really wanted to just regurgitate my first manifesto. I think it responds to the uncertainty that a lot of us have felt at times, as familiar names fall away and new ones come in out of nowhere:

OSM has the potential to be profoundly more than a tech project. When we see someone lavishly micromapping their neighborhood, we can rejoice that we’ve given them and their community a voice, that OSM has broken new ground, that we’re chipping away at an ancient, one-size-fits-all, top-down approach to mapping the world. We’re incredibly lucky that many people have discovered our project and figured out how to contribute. Just imagine how many more people will discover us once we figure out how to speak to their interests.

I’m leaving behind plenty of half-baked ideas and to-do items, but that’s good. Unfinished business is how I got my start too. In any case, I’ll still be around, just not as your friendly but annoying neighborhood politician. That I will leave to my successor, whose position statement you should read and for whom you should vote.

ocdp, CC0

  1. Now I guess you’re tired of online meetings. Come to another in-person one

Location: 42.427, -83.361

Getting to know you

Posted by Minh Nguyen on 25 April 2022 in English.

It’s heartening to know that multilingualism is so valued in this community. I’ve enjoyed being able to kind of get the gist of posts on the new Discourse site that were originally written in German, Spanish, and soon other languages, thanks to the new 🌐 button. More recently, the proposal to install the Translate extension on the wiki has drawn quite a bit of passion both for and against.

Language diversity is important both on principle and in a practical sense. Supporting languages as first-class citizens can be an important tool for growing the project, reaching into untapped sources of new mappers who will improve the map and evangelize it within their communities. But there are strong opinions on how to manage translations, informed by years of pain from both inadequate software and poor translations. One way or another, I hope the buzz around this proposal will translate into a renewed interest in translating the wiki’s guides and tagging guidance, fixing unintended discrepancies across translations, and making it easier to find wiki pages in your language among search results.1 If this extension isn’t the right tool for the job, I hope we can find one that is.

Regardless, I take comfort in knowing that most of the wiki’s translations will be handcrafted by skilled language speakers who understand OSM – with or without this extension.2 Whatever concerns we have about eliminating or preserving semantic differences across translations would pale in comparison to the accidental misunderstanding that would arise from machine translations of the same technical documentation. Machine translations always fill the vacuum when hand translations are lacking.

Voting is open through May 6. The proposal needs 75% support to pass, since it adopted the wiki’s tagging proposal process. Please take the time to carefully read the proposal and its comments before jumping to conclusions. Voting has been suspended.

  1. Even if you aren’t looking for documentation in one of the seven mostly European languages that gets its own namespace for historical reasons. 

  2. That’s more than can be said for some other OSM tools in certain languages

How to chide users for their wiki edits

Posted by Minh Nguyen on 1 April 2022 in English. Last updated on 3 April 2022.

Recently there have been well-reasoned calls to give users blunt feedback when they have strayed. It came to my attention that the wiki has no built-in feature for this social interaction, only the reverse. I have implemented a user script that allows you to chide another user for an edit. For example, I stridently disapprove of this edit from a year ago:

  1. Click the “Chide” button on any edit in page history:
    Screenshot-2022-4-1 Revision history of  Proposed Features Human  - OpenStreetMap Wiki
  2. Click the “Chide” button to confirm:
    Screenshot-2022-4-1 Revision history of  Proposed Features Human  - OpenStreetMap Wiki(1)
  3. Observe that the user has been chided:
    Screenshot-2022-4-1 Revision history of  Proposed Features Human  - OpenStreetMap Wiki(2)

To install this feature, add the following code to your user script page:

// [[User:Minh Nguyen/chide.js]]
mw.loader.load("/w/index.php?title=User:Minh_Nguyen/chide.js&action=raw&ctype=text/javascript");

I hope this enhancement improves the productivity and rectitude of our wiki documentation efforts.

Location: La Séguille, Uzer, Bagnères-de-Bigorre, Hautes Pyrenees, Occitania, Metropolitan France, 65200, France

The unfixable state of township boundaries

Posted by Minh Nguyen on 28 March 2022 in English. Last updated on 27 June 2022.

In the U.S. mapper community, we often joke about how tagging dictates by out-of-staters or people from overseas amount to saying, “Fix your state!” We’re such contrarians over here, probably because we live in such a messy place. In fact, my home state of Ohio exists primarily to give mapmakers heartburn and keep data consumers up at night, especially when it comes to boundaries. At least in this state, making assumptions about boundaries is almost as bad as making assumptions about names.

Administrative boundaries in an ideal world

OSM represents administrative areas as boundary relations that geographically encompass other boundary relations with higher admin_level=* values. In the early days before boundary relations became well-established, some mappers used to represent boundaries as multipolygon relations. The inner and outer relation roles stem from this usage. Data consumers often use similar code and tools to process both boundaries and multipolygons because so many well-known boundaries follow all the same topological rules.

The illustration that accompanies the wiki documentation for the admin_level=* key suggests a simple hierarchy of administrative areas, in which a larger area completely contains a smaller area and so on:

The City of Santa Catarina is wholly within the State of Nuevo León, Mexico. (Alex Covarrubias, public domain)

The humble township

You may be familiar with the most common kinds of boundaries in the United States: states, counties, and municipalities (cities, villages, and towns in some states). In addition to these boundaries, some states like Ohio have civil townships, which are devolved from county government. They provide certain services such as parks, cemeteries, and road maintenance with lightweight administrative overhead. In general, a county is completely subdivided into townships.

The Springfield Township Administration Building in Springfield Township, Hamilton County, Ohio. Some townships are very populous and, as a result, have an even more extensive government than many cities and villages. They even have their own flags. (Nyttend, public domain)

Like the more well-known kinds of administrative boundaries, township boundaries are eligible for inclusion in OSM because they’re just as verifiable on the ground. Unfortunately, they were omitted from the original TIGER boundary import, which focused on incorporated areas rather than what the U.S. Census Bureau calls “minor county divisions”.

A boundary sign for Washington Township, Lucas County, Ohio. (© Elevatorrailfan, CC BY-SA 4.0)

In the years since the import, Ohio’s mappers have been adding township boundaries by hand, one by one. Delving into the intricacies of each boundary, you can learn about many edge cases that blow holes in the standard model presented by computer science textbooks. Local jurisdictions simply have less incentive – or disincentive – to conform boundaries to best practices.

Administrative areas form a tree – false

The following diagram shows the administrative areas that contain the twin border towns of West College Corner, Indiana, and College Corner, Ohio. The numbers on the left indicate the agreed-upon admin_level=* values for these types of boundaries. Townships are tagged admin_level=7, so that municipalities are tagged consistently as admin_level=8 in every state regardless of whether the state has townships.

Administrative boundaries containing the Town of West College Corner, Indiana, and the Village of College Corner, Ohio (as of 2021)

West College Corner’s situation is as straightforward as the illustration on the wiki. However, College Corner’s situation isn’t so straightforward: depending on where you stand in College Corner, you’re either in one township or another and in one county or another.1 This is a fairly common situation in the U.S.: over 700 municipalities span county lines, and countless others span township lines.

West College Corner and College Corner are exceptional in one regard: they share a school district across state lines. There are only a handful of such arrangements in the country. It’s uncommon because each state has a separate educational system, making it difficult to align educational standards and athletic team eligibility. But we don’t map school district boundaries anyways, because they normally don’t leave any trace on the ground.2

An administrative area belongs to each of the administrative areas that contains it – false

Maybe it’s no big deal that a single municipality can exist in multiple counties or townships. After all, municipal and county governments both answer directly to the state government, while a township government answers to the county that erected it. A reverse geocoder can simply say the municipality “belongs” to whatever township or county the input location happens to fall within.

As it turns out, only in Ohio, a township can also extend beyond the county that originally erected it.3 For example, Columbiana County’s Fairfield Township now includes portions of neighboring Mahoning County but remains one of Columbiana County’s townships, not one of Mahoning County’s:4

Administrative boundaries containing the City of Columbiana, Ohio (as of 2021)

This happened because the City of Columbiana annexed some land in Mahoning County and wanted to keep all its residents within the same township. Under state law, Mahoning County was obliged to take some land away from its Beaver Township and give it to Columbiana County’s Columbiana Township while keeping it within Mahoning County.

Most likely, the city wanted to keep things simple and consistent for residents, township employees, and election volunteers. Evidently the mapmakers weren’t considered. Even the U.S. Census Bureau has to correct itself every ten years. But after the city’s newest annexation of Beaver Township land, the city forgot to make the county update the township boundaries, so part of the city is in Beaver Township anyways.

An administrative area’s name is unique within its immediate containing area – false

Maybe it’s no big deal that an administrative area can “leak” into another administrative area that it doesn’t belong to. Why would government reporting structures matter to a reverse geocoder, anyways? For one thing, conflating townships with each of their containing counties would result in naming conflicts.

It’s rare for two municipalities to share the same name in the same county or even the same state. For practical purposes, any community subject to a naming conflict had to rename itself if it wanted a post office, even if it could’ve technically kept its conflicting name for official purposes. The U.S. Postal Service requires every post office to have a name that’s unique within the state. The postal city name is part of every address, so it’s the de facto community name in commerce. But post offices are seldom named after civil townships, so it’s very common for two adjacent counties to have townships by the same name.

For example, Franklin County’s Washington Township also extends into Delaware and Union counties due to annexations by the City of Dublin.5 But Union County already had its own Washington Township at the opposite corner of the county. Whenever Union County’s board of elections holds township trustee elections, they have to clarify which Washington Township is which.

Administrative boundaries containing the City of Dublin, Ohio (as of 2021)

For once, a municipality is in just one township! Dublin would never get sloppy about township boundaries like Columbiana did. In fact, Dublin went all the way to the Ohio Supreme Court to defend its right to force Delaware County to give some of Delaware County’s Concord Township to Franklin County’s Washington Township while keeping it as a part of Delaware County.

For now, Franklin County’s Washington Township remains mostly in Franklin County, so a reverse geocoder may get lucky and associate the township with the correct county. But there’s no guarantee that Washington Township’s centroid will remain in Franklin County: in several years, it’s entirely possible that the Dublin – and thus Washington Township – will annex more unincorporated land in Union County as Columbus metropolitan area continues to experience urban sprawl. Even then, it will remain one of Franklin County’s townships.

Union County’s Washington Township is so rural that it has no incorporated city or village within its boundaries – no part of the township coincides with an admin_level=8 boundary relation. In fact, all of the other townships in these diagrams also have some unincorporated territory, but including this detail would’ve forced me to make these diagrams three-dimensional.

An administrative area’s parents have a consistent administrative level – false

OK, so Dublin’s “parental” relation structure is a mess, but at least every part of Dublin is consistently contained by some township. Can we at least assume a municipality’s parents are all townships at the same administrative level of 7? Nope.

Mapmakers aren’t the only ones who tire of the tortured relationship between townships and municipalities. Many cities and villages across the state have done away with township administration within their borders, folding township services into the municipal government. To abolish township administration of a given territory, a city “withdraws” from its surrounding township by petitioning the county to erect a new township that’s completely covered by the city. Under state law, this “paper township” would have no government and would only exist in the board of county commissioners’ meeting minutes, as well as the occasional mapmaker’s diary post. Over 250 cities and villages have withdrawn from a township.

For example, the state capital, Columbus, has caused Franklin County to erect a “Montgomery Township” that exists only as a paper township. It occupies land formerly part of many townships in three different counties, including Franklin County’s Washington Township:6

Administrative boundaries containing the City of Columbus, Ohio (as of 2021)

As in Dublin, the whole city can enjoy the same township services like firefighting and parks consistently, but these services are provided by the city without any border nonsense.

If only. Columbus also neglected to ask Delaware County to attach some bits of Delaware County’s Orange Township to Franklin County’s “Montgomery Township”. So a small part of the city is under township administration while the rest of it is not. Much bigger problems can arise from discrepancies in township boundaries following an annexation, like the time when Cincinnati incompletely annexed a township, upsetting the balance of power between Democrats and Republicans in the U.S. House of Representatives.

Ohio’s mappers avoid mapping paper townships because they leave no trace in the real world. Instead, we leave a gap at admin_level=7, just as in states that have no townships. At one point, we considered tagging withdrawn municipalities as admin_level=7 to reflect their independent status, but we decided that nuance was more obscure than the distinction between townships and municipalities, so we opted to keep all municipalities at the same administrative level. Just imagine if we had decided on admin_level=7;8 for the 27 or so partially withdrawn cities like Columbus.

We could stop mapping boundaries and these headaches would go away – false

So far, this post has been fodder for mappers who have been skeptical of boundary mapping in the first place. What if they got their way and we just avoid hand-mapping the township boundaries that the TIGER import omitted? There would be other headaches, but without the boundaries to explain why.

Ohio doesn’t just geek out about boundaries; it also geeks out about highway route designations. It’s the only U.S. state where every county chooses its own route marker design (also known as a route shield) for county routes:

But it gets better: in some counties, every township chooses its own route marker design for township routes too.7 The OpenStreetMap Americana renderer recently added support for 92 different township route shields based on network=* values that assume a simple hierarchy (which we already disproved above). It’s very common for a road to be built between two townships so that the road’s centerline is exactly aligned to the boundary between them:

Six roads meet at this four-way intersection at the tripoint of Miami, Pleasant, and Union townships in Logan County: Miami Township Road 33, Pleasant Township Road 33, Union Township Road 33, Miami Township Road 45, Pleasant Township Road 45, and Union Township Road 45.

There are even cases where two adjacent counties have adjacent townships that go by the same name but use distinct route shields – and where a township road was built down the middle:

A short segment of roadway straddles the border between Salt Creek Township, Holmes County, and Salt Creek Township, Wayne County, with Holmes County’s Township Road 608 on one side and Wayne County’s Township Road 440 on the other.

Fortunately, I’ve yet to encounter a township road numbered and signposted as part of a township belonging to a county in a different county than the road (whew). It’s probably unlikely because the main reason for these extraterritorial townships is a city’s annexations, and a city is usually responsible for all the local roads within its territory. But I’ve made each of the unreliable assumptions above at some point in the past, so I’m not about to wager about the impossibility of this edge case either.

The bottom line

If you’ve managed to digest all these oddities about township boundaries, you’ll probably come to the same conclusion I did: that ultimately, boundaries are just lines, and administrative areas are just independent overlays in a Venn diagram, or maybe an org chart with lots of dotted lines. There, I fixed it.

If you’re attending this week’s State of the Map U.S. conference in Arizona, a state sadly devoid of townships, I look forward to geeking out with you about these and other mind-boggling aspects of our corner of the world. If you’d like to help us map the rest of Ohio’s townships, in all their topology-defying glory, jump into the #local-ohio channel in OSMUS Slack.

A township-operated water tower in Madison Township, Richland County, Ohio. (Nick Juhasz, public domain)


  1. Governmental Unit Reference Map (2021): College Corner village, OH, Boundary and Annexation Survey, United States Census Bureau 

  2. What’s a rule without an exception? The Mason City School District put up welcome signs along its entire boundary. Naturally, the district covers more than just the City of Mason and extends into two counties. 

  3. Thanks to Wikipedia users GeoMac and Ibagli for thoroughly disproving my earlier assumption that state law prevented this from happening. 

  4. Governmental Unit Reference Map (2021): Fairfield township, OH, Boundary and Annexation Survey, United States Census Bureau 

  5. Governmental Unit Reference Map (2021): Washington township, OH, Boundary and Annexation Survey, United States Census Bureau 

  6. Governmental Unit Reference Map (2021): Columbus city, OH, Boundary and Annexation Survey, United States Census Bureau 

  7. The City of Fremont, which sits in two different townships, even has its own route shields for city routes, because why not? 

Location: 40.907, -80.699

I’m running for reelection to the OpenStreetMap U.S. board of directors. In my 14 years of grassroots mapping, organizing local communities, and evangelizing OSM, I’ve witnessed the community and ecosystem grow tremendously while remaining true to its humble roots.

The past year has proved that big things start small. Who could’ve predicted that a complaint from a park manager would turn into a thoughtful Trails Working Group, or that an offhand comment in a long Slack thread would inspire our community’s cartographers to come out of the woodwork and collaborate on a new OSM Americana renderer? We tend to think of OpenHistoricalMap as a daunting blank slate compared to OSM, but you should’ve seen people’s eyes light up at WikiConference North America when they learned about the project. You make all of this possible through your creativity, hard work, and financial support; the board is right here alongside you to connect the dots and grease the wheels.

OSMUS has matured to the point that the board no longer needs to run the day-to-day affairs of the organization, which frees us up to do what we’re better at. It’s up to us to have a big-picture, long-term vision for the organization. We funnel the U.S. community’s many needs into a coherent strategy. As representatives of the community, we engage with other communities and organizations, seeking to turn their interest in OSM into a source of energy and diversity for the project. Collectively, we support our staff by providing ideas, scrutiny, and encouragement in healthy doses.

All that may sound distant and abstract, but I’m also one of you. I wear multiple hats in the community, participating in working groups, socializing in Slack, tinkering on software, and applying elbow grease to the map. In fact, I spend more time doing stuff as an ordinary community member than formally as a board member.1 This is how I stay grounded, even as I reach out of my comfort zone, seeking opportunities for OSMUS to bring more people from more backgrounds into this community.

My crystal ball is as cloudy for 2022 as it’s been over the past two chaotic years. But I believe this is the time for us to take the connections we’ve fostered online and apply them to the real world. Many cities and states still lack a group of dedicated mappers who know and meet each other, recruit others, and have contacts within their local communities. We need to foster this basic foundation in order to build a sustainable, diverse movement. The small staff of OSMUS doesn’t have the resources and time to be everywhere, but with adequate support and guidance, our community can be more than an online community and we can reasonably aspire for our map to be comprehensive and essential.

I encourage you to read the other candidates’ position statements and cast your vote by February 9th. In addition to voting for the board, please remember the part about the proposed change to the bylaws. Thank you for your consideration!

  1. As for my day job, I indirectly work with OSM data at Mapbox, where I develop navigation software for iOS and everyone knows me as a diehard fan of OSM, but I’m my own board member and mapper. 

Location: Saddleback Ridge, Cobb County, Georgia, 30168, United States

A recent id-tagging-schema pull request introduces presets specific to Germany that would make it easier for mappers there to tag schools by type based on locally understood terminology. It’s a great idea, one that hopefully will be extended to other countries like the United States in due time. Some Americans will see a “Kindergarten” preset and intuitively expect a complementary “Elementary School” preset too.

School type presets wouldn’t just be a matter of convenience to mappers. Local maps of the U.S. conventionally distinguish between different types of schools, namely between elementary schools, middle schools, high schools, and colleges and universities. I’d like to eventually see OpenStreetMap-based maps that make the same distinctions.

Fort Worth

School classification has long been a tricky subject in OSM. There are at least three documented, machine-readable schemes for classifying schools:

school=* and grades=* focus on characteristics that are verifiable on the ground. For Americans, there are many reasonable sources for these keys, including signs, websites, and process of elimination. But the downside is that they’re subject to local variation: school=* would be applied differently from one school district to another, and grades=* is uniform but only within the U.S.

Oak Hall School The Oak Hall School system in Gainesville, Florida, divides its schools at the most common grade levels but uses uncommon names for the schools. Deriving school classifications from name=* would be impractical due to idiosyncrasies like this. (© 2009 Ebyabe, CC BY 2.5)

isced:level=* has been promoted as a more uniform, globally applicable alternative to both school=* and grades=*. However, the application of ISCED levels also varies by country. In some countries, the definition is objective and fits well with the local educational system. But in other countries, the levels are much less relevant to how people normally classify schools.

In the U.S., the lower ISCED levels are officially derived from grade numbers, while the higher levels are based on the type of academic degree offered. Levels 0 through 3 are divided at thresholds that are unfamiliar to most Americans, such as “secondary school” (level 3) being limited to grades 10 through 12. In 2011, the higher levels were redefined for the U.S., making any existing isced:level=5/6 tags ambiguous. I don’t know if further refinements to ISCED are planned, but it should concern us that the levels can simply be redefined independently of any changes to the U.S. educational system or to schools on the ground.

Teays Valley High School Teays Valley High School in Ashville, Ohio, is one of over 16,000 public high schools in the U.S. that serve students from 9th grade through 12th grade and thus straddle ISCED levels 2 and 3. (© 2013 Aesopposea, CC BY-SA 3.0)

To better understand the relationship between ISCED levels and the U.S. educational system, I analyzed a pair of nationwide, authoritative datasets of 99,338 public schools and 22,440 private schools published by the National Center for Education Statistics (NCES) for the 2019–20 and 2017–18 school years, respectively. These datasets include schools offering instruction up to 13th grade and some adult education schools, but they do not include postsecondary institutions. I exported the tables as Excel spreadsheets, mapped the grade spans to ISCED levels, and added pivot tables to get aggregate statistics. I’ve posted the resulting spreadsheets to Google Drive, though it’s not much more sophisticated than what you’d export directly from NCES:

Among the 121,778 schools known to NCES:

  • 108,983 schools (89%) have verifiable grade numbers. (Most of the remaining private schools do not assign students to grade levels, while most of the remaining public schools did not report their grade levels.)
  • The ISCED levels exactly correspond to only 2,558 schools (2.1%):
    • Level 3 is the best-fitting level among public schools, corresponding to 521 schools (0.52%). These are generally senior high schools in districts that have spun off a separate junior high school, which would not fit any ISCED level. The poorest-fitting level is level 1, corresponding to 117 schools (0.12%).
    • Level 0 is the best-fitting level among private schools, corresponding to 2,097 schools (9.3%). Private preschools and kindergartens are very common in some states. The poorest-fitting level is level 3, which doesn’t correspond to a single private school in the entire U.S.
  • A mere 12,561 schools (10%) can be tagged with a single isced:level value; 80,610 (66%) must be tagged with two values, 18,896 (16%) with three values, and 7,649 (6.2%) with four values.
  • Ten distinct values of isced:level are possible. The most common values would be isced:level=0;1 (44,359 or 36%), followed by isced:level=2;3 (21,904 or 18%) and isced:level=1;2 (14,347 or 12%). The least common value would be isced:level=3 (1,016 or 0.83%).

It’s fine to combine multiple ISCED levels in the same tag. After all, most schools would have multiple values in grades too. Rather, the problem is that it isn’t possible to reliably derive the colloquial school classifications from the ISCED levels: for example, isced:level=1;2 can’t distinguish between a 1–8 elementary school and a 6–8 middle school. These terms are used inconsistently from school district to school district, but the map would be expected to reflect this inconsistency.

Hoboken Elementary School This school in Hoboken, Georgia, has remained an elementary school since the 1960s, even as a changing grade span would’ve caused ISCED to classify it variously as levels 1 and 2, levels 0 through 2, and levels 0 and 1. (© 2013 Michael Rivera, CC BY-SA 3.0)

isced:level=* is the only classification system of the three that has global ambitions. The ISCED levels were designed for statisticians, but the scheme’s inclusion in OSM can only achieve its potential for statisticians if we also adopt them in the U.S. So despite the scheme’s problems from a local perspective, mappers might as well consider tagging isced:level=* in addition to the more immediately practical school=* and grades=* keys, even as data consumers should take care not to infer too much detail from isced:level=*.

In raw numbers, OSM actually knows about more schools than are in the NCES dataset. However, most of them were imported from GNIS; many closed long ago or have been renamed since the import. As the U.S. mapping community works to clean up the imported data, the public domain NCES dataset and similar datasets from state education departments will be a fantastic resource, but classifying schools as users expect will require more human attention than simply translating grade levels to a different numeric scale.

Updating names in Texas

Posted by Minh Nguyen on 14 June 2021 in English. Last updated on 23 June 2021.

Last week, the U.S. federal government finally agreed to retire a number of racially insensitive names of landforms and bodies of water in Texas, 30 years after the state legislature petitioned the federal government to rename them after accomplished Black Texans. (Most of them had originally been named with an even worse racial slur.) OpenStreetMap has been updated to reflect the new names that are in GNIS, the federal government’s official gazetteer. The corresponding Wikidata items have also been added or updated, to prevent data consumers from overriding OSM names with the offensive old names, but also to link to more information in Wikidata and Wikipedia about the person whom the feature now commemorates.

Most of the features had to be mapped for the first time, because GNIS doesn’t have enough detail about linear features like valleys and creeks to import them, and NHD had only been imported in a few parts of the state. Except for Emancipation Pond, which is in a residential development under construction, a traveler is unlikely to ever stumble upon these remote features in the vast Texas landscape. Even so, much more accessible locations get renamed practically every day. Hopefully these OSM and Wikidata entries will serve as a handy model for mappers to follow as we find more efficient ways to track and respond to name changes.

Updated name OSM feature Wikidata feature Wikidata namesake
Freedom Hollow Added Added
Hendrick Arnold Bluff Renamed Renamed Added
Buffalo Soldier Creek Added Added
Bill Pickett Hill Renamed Renamed
Jack Johnson Creek Added Added
Lake Henry Doyle Added Added Added
Lake William Goyens Renamed Added Added
Matthew Hooks Reservoir Renamed Added Expanded
John Horse Hollow Added Added Expanded
George Ruby Bend Added Added Expanded
Norris Cuney Gully Added Added Expanded
Negros Liberty Settlement (abandoned) Removed
Leonard Harmon Hollow Added Added
Ada Simond Creek Added Added Expanded
Milton Holland Creek Added Added Expanded
Emancipation Pond1 Added Renamed
Kiamata Creek Added Added Added
Henry Flipper Hill Renamed Renamed Expanded
Negro Tank (demolished) Removed
Buffalo Soldier Draw2 Added Renamed

Position statement for 2021 OpenStreetMap U.S. board election

Posted by Minh Nguyen on 25 January 2021 in English. Last updated on 22 January 2022.

I’m running for reelection to the OpenStreetMap U.S. board of directors.

For those who don’t know me, I’ve been contributing to the OpenStreetMap project as a volunteer since April 2008, mostly as a mapper and an advocate for the project. I love pondering tagging dilemmas and seeding the map with a level of detail that pleasantly surprises users and gets them off the sidelines. (As for my day job, I’m proud that the iOS software I write at Mapbox is powered by OSM data, but I’m my own board member and mapper.)

In my position statement last year, I wrote about the need to build bridges. Since then, OSMUS and the OSMF achieved normalized relations via a local chapter agreement. Without the distraction of local chapter negotiations, we can look forward to partnering with OSMF in forging less obvious relationships that bring more participants into the OSM project.

I had looked forward to meeting many of you at this year’s State of the Map U.S. conference in Tucson. Instead, we responded to the upheaval of 2020 by organizing the Connect conference and continuing a series of Virtual Mappy Hours that ranged from imports to issues of social justice – all at a safe distance online. I hope you found these events to be as worthwhile (and as much of an escape) as I did.

As a board member, I arguably had the least hands-on role in each of these team efforts. My job has been to connect them to the bigger long-term picture. It’s important for me to give our executive director, Maggie, the room to get the implementation details right but also be available for a gut check or proofread as needed.

In 2021, that bigger long-term picture becomes more concrete. Charter programs and our collaborations with non-profits, the public sector, and corporations are evolving OSMUS beyond an organization that merely organizes events. As we give these efforts a chance to blossom, we must also prioritize the health of the existing community. There are still many hurdles keeping people from getting more deeply involved in OSM’s decisionmaking and organizing. As a board member, I would support and advise Maggie in discovering and addressing these barriers.

I encourage you to read the other candidates’ position statements, hear more from us at the upcoming town hall on Wednesday, and cast your vote by February 7th. In addition to voting for the board, please remember the part about the proposed change to the bylaws. Thank you for your consideration!

capk11, CC BY-SA)

Location: 42.447, -83.361

Help us add businesses in Silicon Valley

Posted by Minh Nguyen on 7 December 2020 in English. Last updated on 18 April 2021.

Here in San José, we’ve begun importing tens of thousands of businesses from an official registry of South Bay businesses and other points of interest that are open during the COVID-19 pandemic. When we’re done, our POI coverage will look similar to this visualization:

POIs in Santa Clara County POIs in Downtown San José

We want you to be a part of the import effort! Go to this MapRoulette project and follow the instructions to get started. It’s a safely socially distanced activity and a small way to help the local community come out stronger after the pandemic (not just the local tech industry).

If you’ve never participated in an import before, this is a good opportunity to learn, because you can use the same editor your normally use. (For me, that’s iD.) Each challenge corresponds to a different business category, so you can pick the kind of POI you’re most comfortable mapping.

Example MapRoulette task

You don’t need to live in the Bay Area to participate. In fact, even mappers outside the U.S. have an interest in comprehensive POI coverage here in Silicon Valley. For better or worse, OSM’s reputation is partly based on its reputation among tech companies. Everyone evaluates a map service by searching and navigating while running errands, and tech company decisionmakers are no exception. If OSM can deliver a good experience in Silicon Valley, we’ll have more opportunities to serve people elsewhere, including in places where OSM is already a hidden gem. This import will also serve as a model for other cities to supplement their POI coverage with similar data sources.

If you have any questions or would like help getting started, please feel free to send me a message or invite yourself to OSMUS Slack’s #local-california channel. Thank you!

Location: Downtown Historic District, San Jose, Santa Clara County, California, 95113, United States

A limited time weight reduction offer

Posted by Minh Nguyen on 3 October 2020 in English. Last updated on 31 December 2020.

The other day, while adding some Ohio county roads to route relations, I came across a baffling weight limit sign:

Lilly Chapel–Georgesville Road looking north from London–Lockbourne Road

As complicated as it can be, OpenStreetMap’s maxweight tagging is designed around explicit numeric values. What good is a 10% discount when you don’t know the full price?

A state bridge inspection manual pointed out that this sign was once standardized as sign R12-H7 in the Ohio Manual of Uniform Traffic Control Devices (OMUTCD), but the sign was removed from the standard in 1997 in favor of explicitly posting the specific weight restrictions by axle count. (Old signs like this often remain until they wear out and the local highway department needs to replace them.)

At the same time, I discovered that a similar percentage-based sign has remained in the standard, now renumbered as R12-H17. Counties and townships are allowed to post it on roads and bridges to protect them during thawing season. (Other northern states have similar provisions.)

OMUTCD R12-H17

After a few days of research, I managed to come up with a machine-readable representation of R12-H17. The sign implicitly refers to a complex section of the state legal code that defines the legal truck configurations and weight limits associated with each configuration. I tried to distill that down into the usual conditional tagging syntax. It’s a mouthful compared to what’s literally on the sign:

maxweight:conditional=12 st @ (Feb 1-May 15)
maxweight:hgv:conditional=12 st @ (Feb 1-May 15 AND axles=2); 36800 lbs @ (Feb 1-May 15 AND axles=3); 43200 lbs @ (Feb 1-May 15 AND axles=4); 49600 lbs @ (Feb 1-May 15 AND axles=5); 55600 lbs @ (Feb 1-May 15 AND axles=6); 31 st @ (Feb 1-May 15 AND axles>=7)
maxweight:hgv_articulated:conditional=32 st @ (Feb 1-May 15)

As far as I can tell, there are currently eight legal truck configurations in Ohio: 2F1, 3F1, 4F1/SU4, SU5, SU6, SU7, and 5C1. The SU* configurations are for special hauling vehicles (SHVs), also known as single unit vehicles, for example cement trucks and garbage trucks. The single unit configurations appear to be uniform throughout the country, but the others may vary by state.

Unreduced weight limits by configuration
ConfigurationAxlesArticulatedUnreduced legal limit
2F12No15 short tons (14 t)
3F1323 short tons (21 t)
4F1427 short tons (24 t)
SU4
SU5531 short tons (28 t)
SU6634¾ short tons (31.5 t)
SU7738¾ short tons (35.2 t)
5C15Yes40 short tons (36 t)

The configurations are primarily known by the number of axles, and secondarily by whether the truck is a single unit (including a special hauling vehicle with closely spaced axle groups) or a truck-trailer combination. The general-purpose weight limit sign, R12-H5, identifies the configurations by these two aspects. However, the regulations are very particular about the spacing between any two axles and how much weight is applied to each axle. In some configurations, the axles are unevenly spaced and have different weights applied to them. For both signs, I ignored everything except for the axle count and unit count. I’m assuming that any truck configuration that’s illegal in the State of Ohio would be out of scope for the maxweight key anyways.

OMUTCD R12-H5

I alternated between expressing some limits in short tons and others in pounds. In Ohio, the authorities use pounds and kips in regulations and manuals, but they only post tonnages on signage. (Compare to Texas, which only uses pounds on signage.) I only used pounds for some cases because the percentage reduction would’ve resulted in a fractional limit and ambiguity about rounding and significant digits.

Given that the weight limit reduction sign is relative to unsignposted state laws, the actual values will change the next time the law changes. This is unfortunate but, in my opinion, an acceptable tradeoff for keeping data consumers from having to navigate the complexity of legal load limits that vary by state. The relevant state law was last updated in 1993, though the SHV configurations were introduced more recently, around 2016. I don’t expect the laws to change frequently. But just in case, I’ve also been mapping traffic_signs and also adding ad-hoc tags like maxweight:relative=-10% and maxweight:start_date=1989-09-12, which will make it easier to find these roadways to update.

This effort was only for a single standard sign design in Ohio, but hopefully the reasoning here will help others as they try to make sense of regulations and signage in other U.S. jurisdictions.

Photo courtesy of jbthemilker, hero of Ohio’s armchair mappers, and licensed under CC BY-SA 4.0.

Location: Fairfield Township, Madison County, Ohio, United States

Position statement for February 2020 OpenStreetMap U.S. board election

Posted by Minh Nguyen on 27 January 2020 in English. Last updated on 5 February 2020.

I’m running for reelection to the OpenStreetMap U.S. board. I’ve been contributing to the OpenStreetMap project as a volunteer since April 2008, mostly as a mapper and an advocate for the project. (My day job, writing iOS software at Mapbox, also intersects with OSM to some extent.) Last April, you elected me to the board to fill Maggie Cawley’s seat after she became our executive director. Thank you for taking a chance on me – I’d be humbled to continue to serve the community in this capacity.

I like to think I left things a little better than I found them. By the time I began nine months ago, board meeting minutes hadn’t been published publicly for over two years. As secretary, I’ve published minutes of each monthly meeting as soon as the board approves them at the following meeting. It may be some of the least exciting stuff I’ve ever written for the Internet, but published minutes are an important way for the OSMUS organization to stay in touch with its members. In conjunction with the monthly newsletters that I can’t take credit for, you know what’s on our radar and – just as importantly – can find out if something isn’t. Whoever wins this election, I hope the board will keep up the momentum. (If you have any feedback about the contents of these minutes or know of something else the board should take up, please let us know.)

Robert’s Rules aside, I could tell you about my work to train new mappers, improve documentation, advise on tagging proposals, and moderate thorny disputes, each of which have picked up to some extent over the past year. But the truth is that none of these activities strictly requires a seat on the board. What a seat on the board affords is a platform to steer the organization and use it to promote a vision for the broader project.

My ongoing priorities for OSMUS, which I outlined in my previous position statement, can be summed up as building=yes bridge=yes. (Building bridges, get it?)

Last year, I had the privilege of attending and speaking at State of the Map in Heidelberg. People warned me that I was going to hear an earful from people who didn’t have much good to say about the U.S. community. In fact, more than anything, the folks I met were curious about the Americans and wanted us to be better integrated into the global project. To the extent that there are unresolved issues preventing, say, OSMUS from becoming a local chapter, they seem finally solvable and the right discussions with the right people will get us there. The U.S. community as a whole already has an outsized, if soft-spoken, role in OSM, but reducing friction and increasing cooperation between the local and global communities will enable U.S.-based individuals and corporations, mappers and developers, users and advocates to participate more fully in the project.

Building bridges is important because we have a lot of room for improvement. Our meetups don’t reflect the diversity of the country we map. We constantly have to explain why our project matters when people find the competition so convenient. Our map contains a lot of cruft, and the processes and resources needed to clean it up aren’t always readily available. There are technical approaches to each of these problems, but they can only go so far unless we also step outside our comfort zones and connect with more people. As a board member, I would support and advise the executive director in engaging with community organizations, corporations, and program sponsors.

Our project’s ambitions are broad but at times difficult to articulate. For one thing, we can improve by being more than a traditional map and embracing unconventional methods. Whatever our tactics for advancing the project, it’s critical to keep our eyes on the big picture, as if we have nothing to lose.

I encourage you to read the other candidates’ position statements, hear more from us at two town halls, and cast your vote by February 9th. Thank you for your consideration!

capk11, CC BY-SA)

Location: 42.447, -83.361

Local color

Posted by Minh Nguyen on 25 January 2020 in English. Last updated on 27 January 2020.

(This post is cross-posted from a recent post on my blog and adapted for an audience already familiar with OpenStreetMap.)

A year ago, I was pretty sure I’d be spending all my free time mapping buildings and turn lanes. I did contribute plenty of them, but I also have a tendency to get distracted by ideas out of left field. During the past year, I wound up focusing on several kinds of features that never make it onto conventional maps. At some point, I took up mapping flags.

A taboo

The first atlas I owned as a kid was The Picture Atlas of the World (Kemp & Delf). The beautifully illustrated maps and infographics endeared this volume to me for years, but it was the colorful ring of national flags around the front cover that made it irresistible to me at the bookstore. It’s a wonder that my parents gave in to my pleas and purchased this atlas, despite the “red flag” of the Socialist Republic of Vietnam gracing the cover. My grandparents fled the Communists in the ’50s, and they with my parents fled the Communists again in the ’70s. Like many refugees, they longed for Vietnam – especially after searching in vain for Vietnamese food – but hearing about life there today, good or bad, would often elicit dismissive eye-rolling about the Communists.

The Picture Atlas of the World 
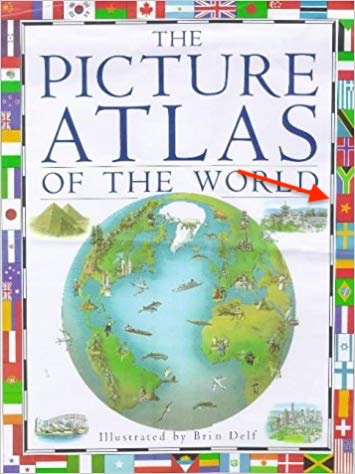
The flag of the Socialist Republic of Vietnam appears on the cover of this children’s illustrated atlas. (© Dorling Kindersley, used for critical commentary)

That was in a suburb of Cincinnati where Vietnamese are few and unknown. It was a bit easier for them to put the war behind them when no one around them seemed to know or care about Vietnam. But that wasn’t the case everywhere. Whenever we visited a Little Saigon in another city, I was fascinated by all the steps they had taken to maintain civic continuity with the old country: the major streets renamed “Sài Gòn” and “Trần Hưng Đạo”, the veterans marching in ARVN fatigues on holidays, the South Vietnamese flag raised proudly beside the American flag.

Wilcrest 
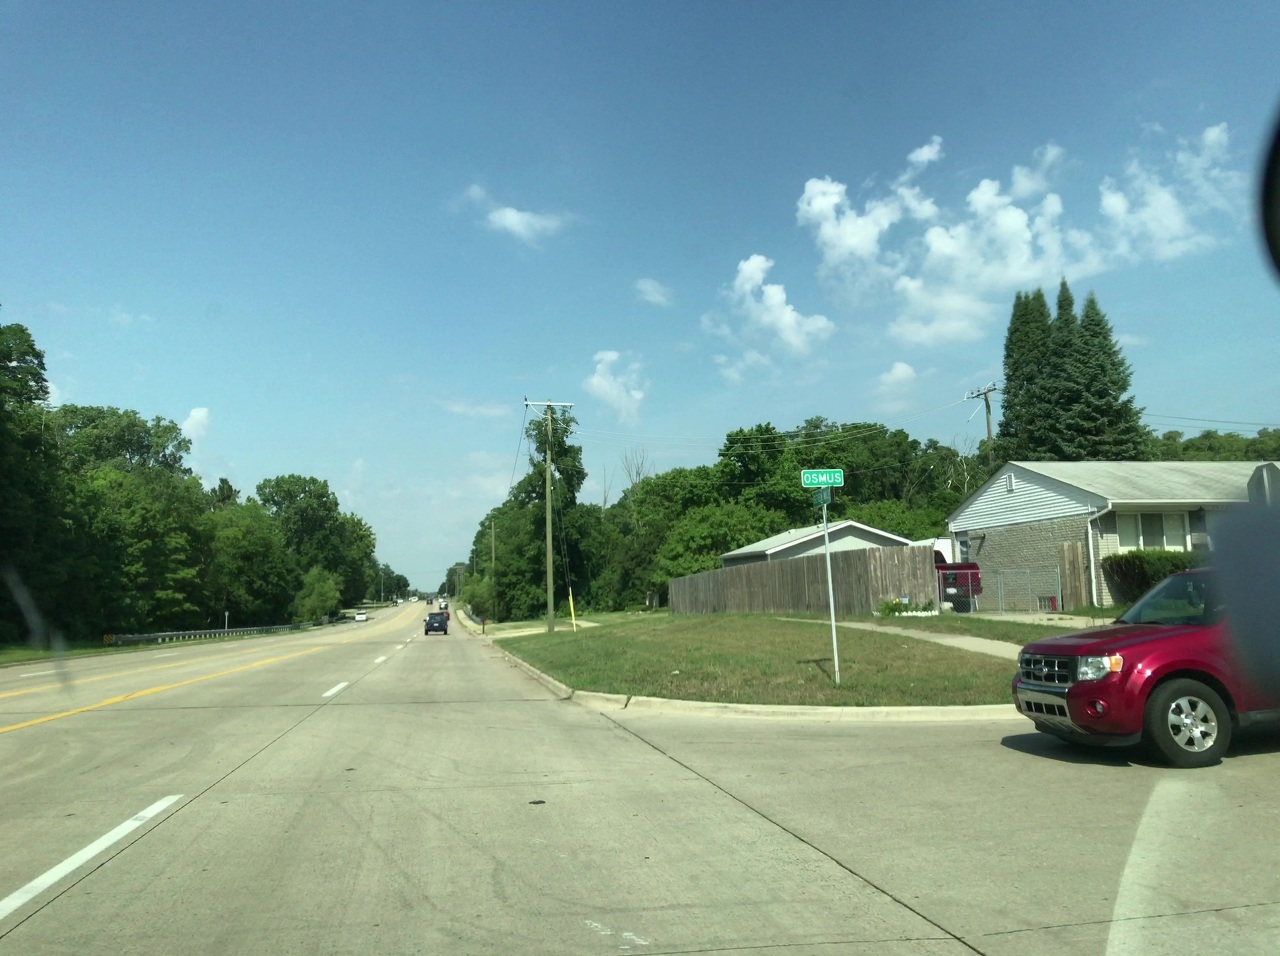
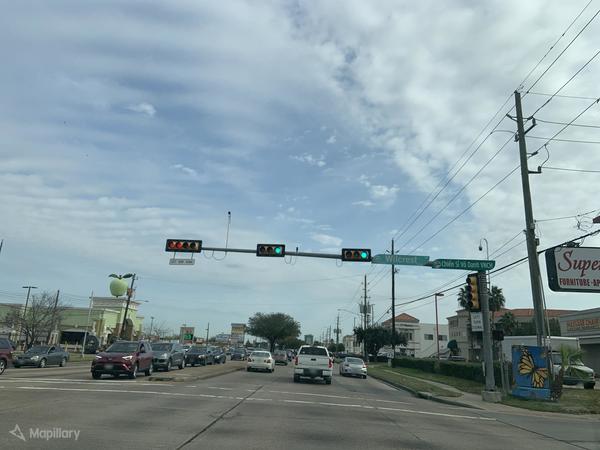
The City of Houston has renamed the major thoroughfares in its Little Saigon, posting Vietnamese signs of equal prominence as the older, more pronounceable English signs. Here, Wilcrest Drive has been renamed in honor of the unnamed soldiers of the Republic of Vietnam Military Forces (Chiến Sĩ Vô Danh VNCH). OpenStreetMap is the only online map that indicates the Vietnamese name, which is increasingly important for navigation as the English sign fades. (© Mapillary, CC BY-SA)

Later I’d learn that activists have convinced numerous city councils and state legislatures to give the South Vietnamese flag official status, regardless of international diplomacy, usually under a name like “Heritage and Freedom Flag”. The “yellow flag” is so important to these communities that, once in awhile, some official or business owner will unwittingly spark outrage, protests, and apologies by flying the wrong flag to represent the local Vietnamese American population.

Người Việt 
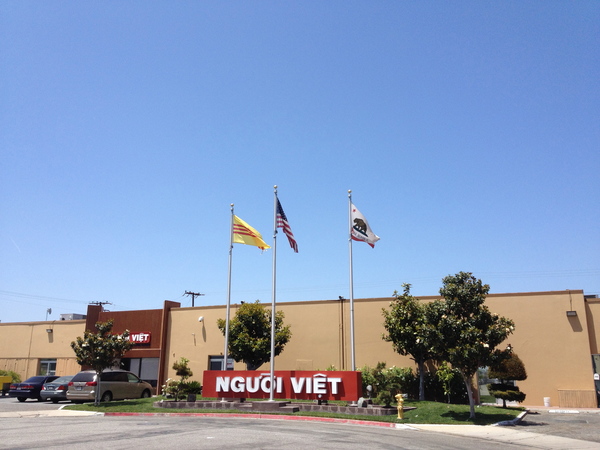
The South Vietnamese flag flies at equal height with the American and California flags outside the offices of Người Việt, a Vietnamese-language newspaper. (© Codobai, CC BY-SA)

Name that flag

About six years ago, I noticed an approved scheme for mapping flagpoles and the flags that fly on them. According to the scheme, flags are classified as “national”, “regional”, “religious”, etc., and national flags are identified by ISO 3166 country code. It was specific enough to precisely describe most of the flags in my hometown, so I didn’t think much more of these tags after mapping a few American and state flags. I had more important things to contribute to OSM anyways, like redrawing roads that the Census Bureau had turned into abstract art.

Vietnam War Memorial in Houston The Vietnam War Memorial in Houston’s International District took over the middle of a shopping center parking lot. This being Texas, the flags are large enough to easily identify in aerial imagery. (© WhisperToMe, public domain)

But then I started mapping Little Saigons. Nothing marks these communities as indelibly as the South Vietnamese flag. It’s the first thing to map, more important than the buildings and businesses. Yet no one has ever compiled a comprehensive listing of the places where the South Vietnamese flag flies. For that matter, no one has ever made a comprehensive map of these flags. That makes OSM the perfect place to start one.

Unfortunately, when I started mapping South Vietnamese flags, the approved flag tags were too imprecise to identify it, because folks hadn’t considered that a flag could outlast its country. As it turns out, South Vietnam’s ISO country code was VN, but after the war, the ISO obsoleted North Vietnam’s VD and repurposed VN to represent the reunified Vietnam – one of the spoils of war, apparently. I couldn’t simply tag these flags as flag:type=national and country=VN, as the OSM Wiki suggested, without fearing that an OSM-powered map would automatically depict them as Communist flags in the heart of a fervently anticommunist community. Indeed, OSM2World would color the South Vietnamese flag red based on the ISO country code, though it is possible to override the color explicitly.

Vietnamese flag at United Nations Headquarters 
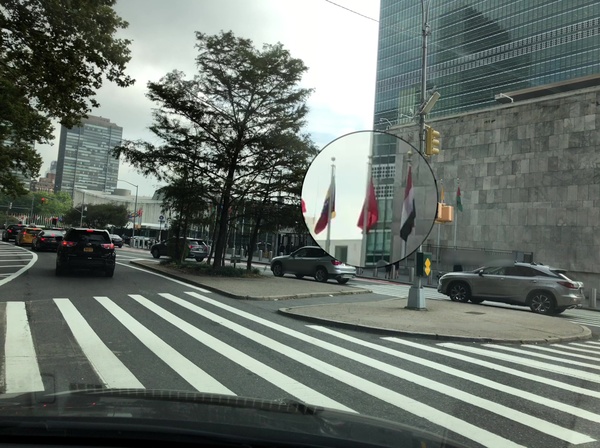
As far as I know so far, the only flag of Vietnam that flies outdoors in the U.S. on a permanent basis is the one outside the U.N. headquarters in New York. (© Kriss Omana, CC BY-SA)

A quick search in taginfo showed me that someone had coined a more freeform flag:name key in 2014 and used it ad-hoc on a few flags without documenting the key on the wiki or campaigning to get it approved. flag:name=South Vietnam was an improvement in that I could make sure other mappers know which flag it is. But there was little chance that a future flag-bearing map renderer would special-case specific values of this key, given the sheer number of flag designs and the fact that the name could differ based on the local language where the flag flies. I needed to pair flag:name with another key set to an external identifier, which a renderer could use to look up machine-readable details in an external database.

I knew of two projects attempting to comprehensively catalog flag designs: Flags of the World and Wikidata. Both contain entries for the flag of South Vietnam, but I figured I’d eventually map other flags that weren’t in either database. My previous e-mail submissions to Flags of the World went nowhere, whereas anyone can create new Wikidata items while mapping. Moreover, Flags of the World lacks strictly unique identifiers: each webpage does have a somewhat memorable URL slug, but multiple flags can be documented on the same webpage. By contrast, Wikidata is organized around unique item identifiers (also called QIDs). It also has an API that makes it easy for software to reliably look up details, such as the flag’s aspect ratio, a scalable image to render, or even the Flags of the World URL slug if necessary.

Usage history of flag:name and flag:wikidata 
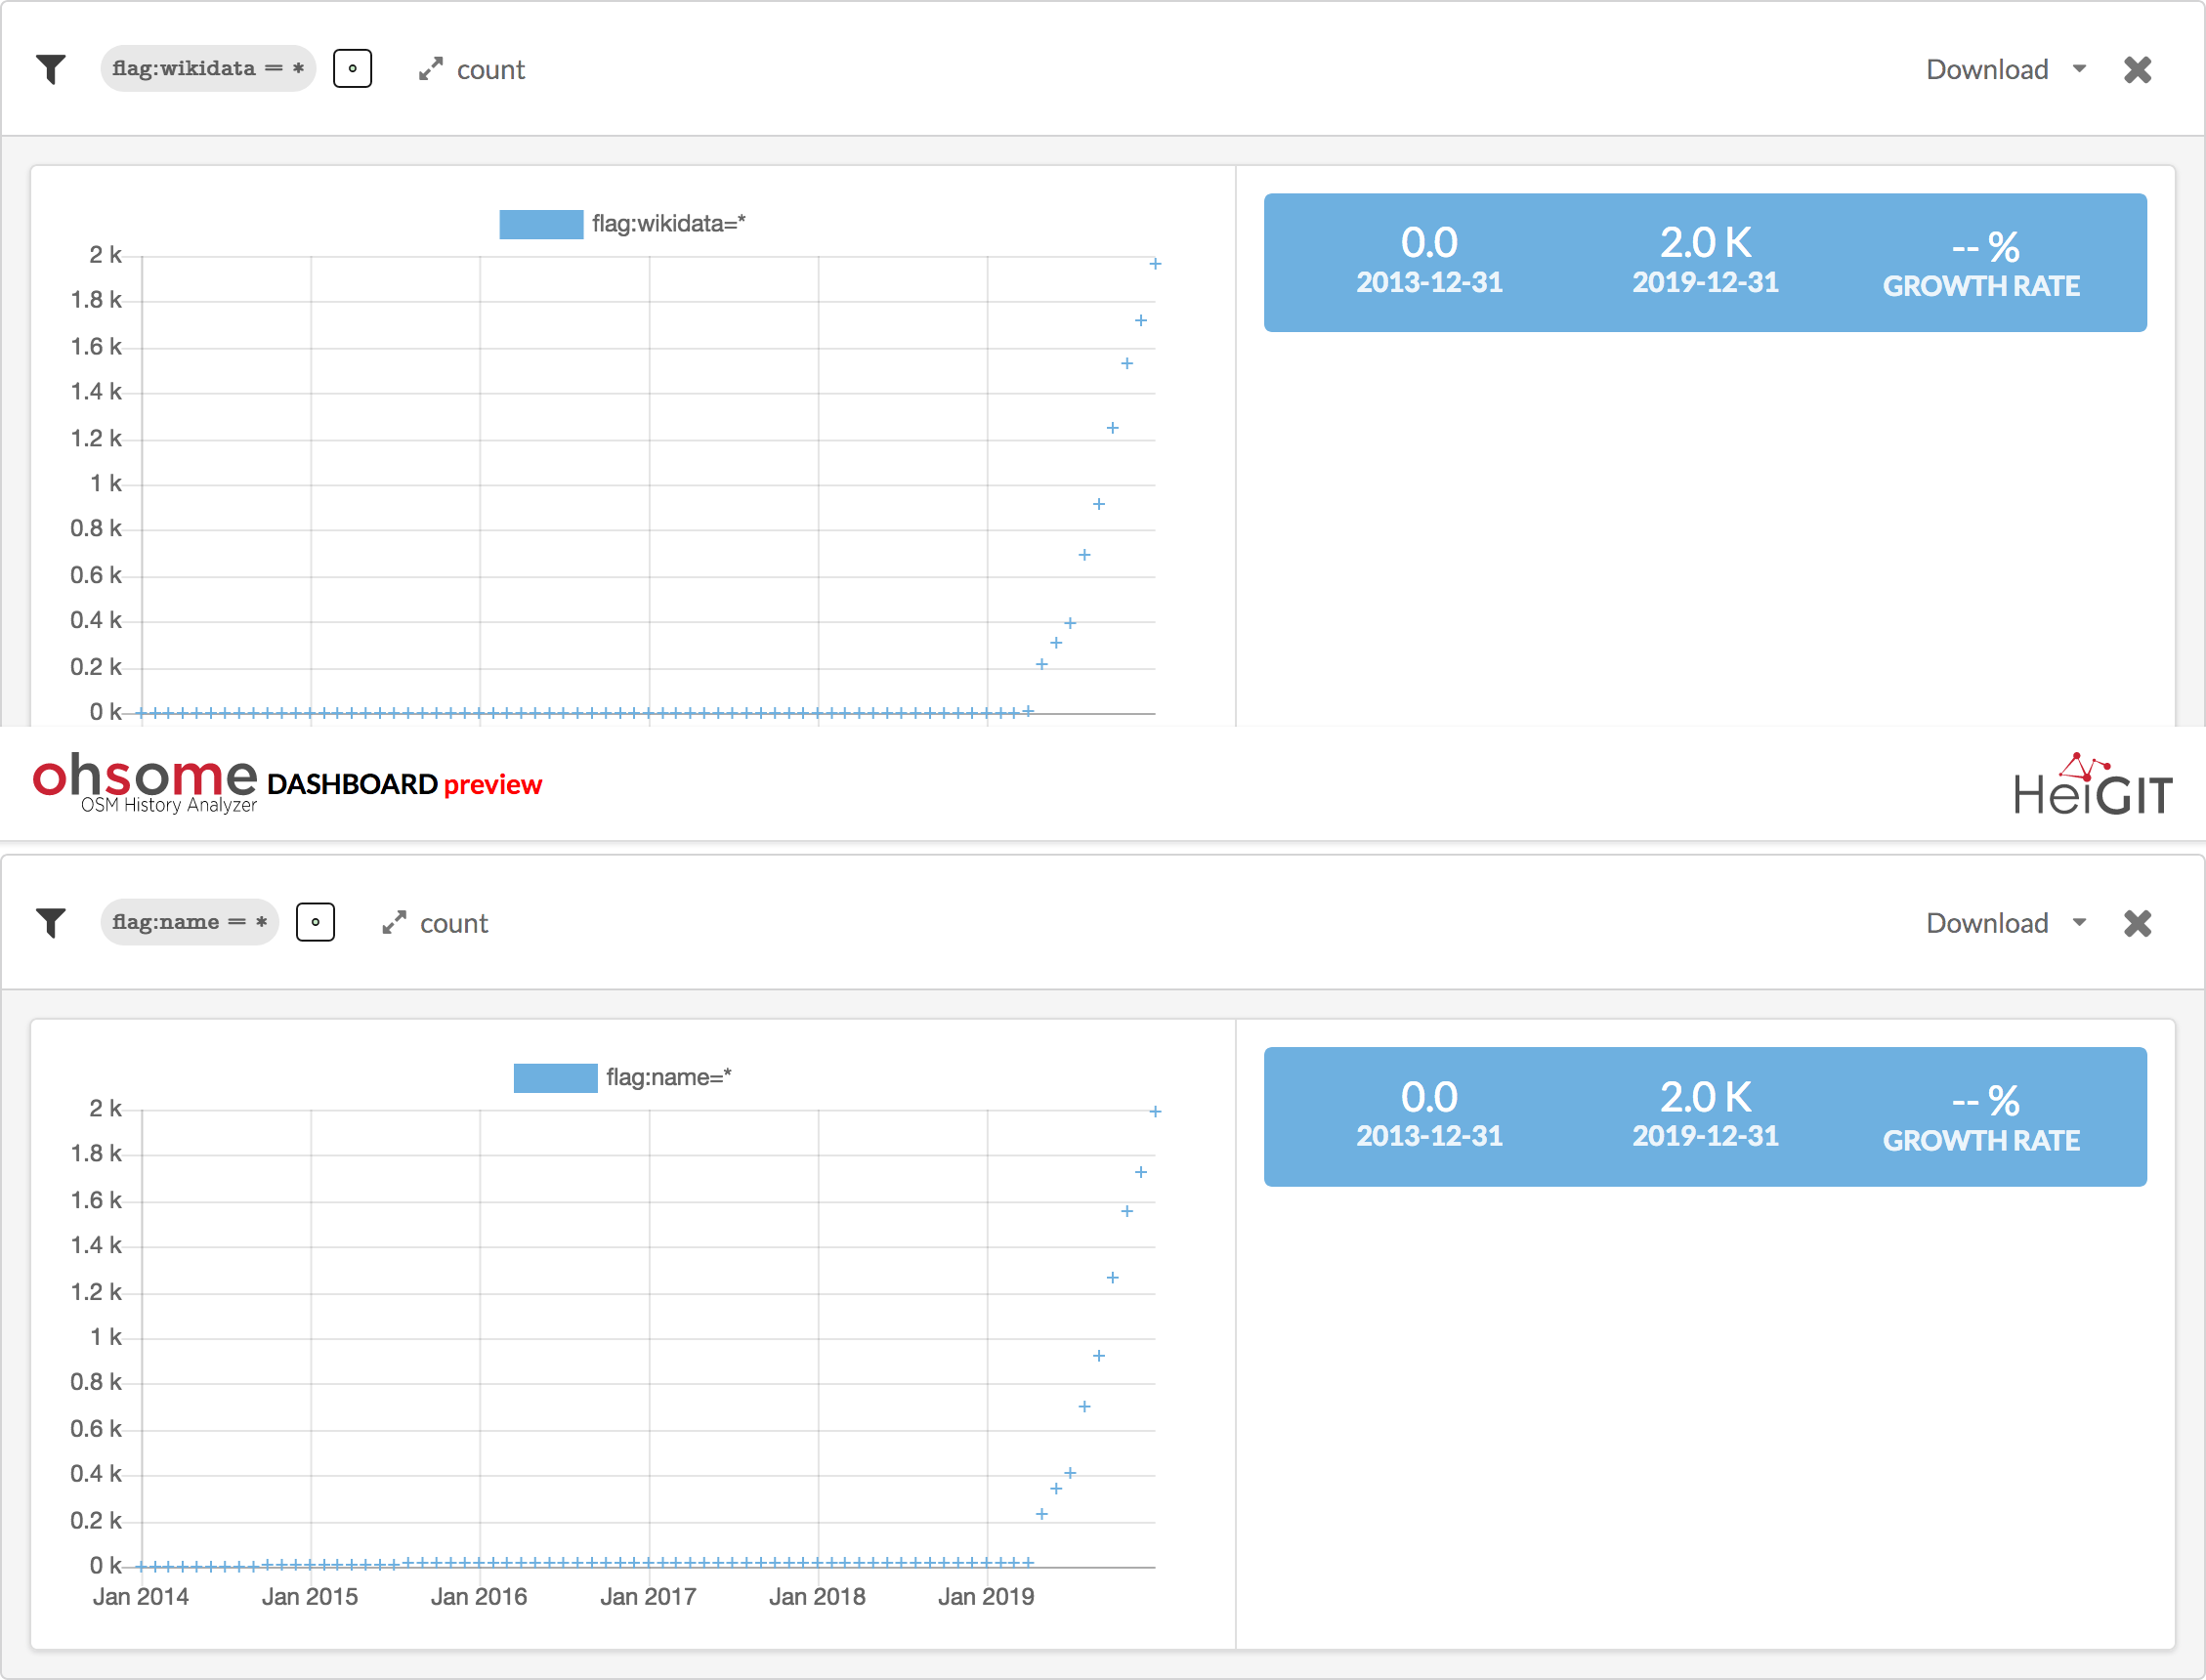
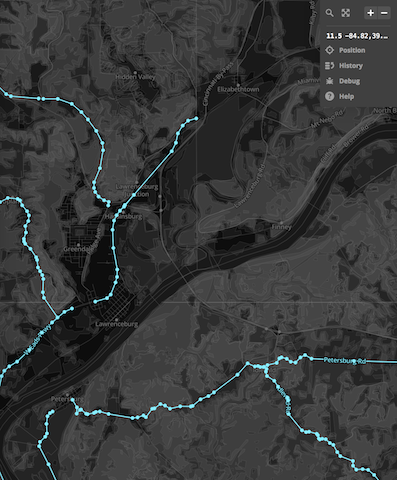
The Ohsome analysis tool shows flag:name was introduced in 2014 but went virtually unused until last year. flag:wikidata was introduced last year as well, and both keys have rapidly increased in usage. (© HeiGIT, map data © OpenStreetMap contributors, ODbL)

flag:wikidata follows the example of several other common keys that are set to QIDs, so I could use this key a bunch of times and expect other mappers and renderer developers to intuit the meaning behind it. But just in case, I informally suggested this new key on the man_made=flagpole tag’s talk page and eventually documented both flag:name and flag:wikidata on their own wiki pages to raise awareness.

Praying for a gentle breeze

Now I needed to get more flags on the map, to prove out the idea of tagging specific designs. I turned my attention back to my hometown and its mundane collection of American and state flags. Actually, I had missed plenty of other flags that needed QIDs for disambiguation: the five flags of the U.S. Armed Forces turned up at veterans’ memorials and outside the homes of many veterans. Some Catholic churches and cemeteries fly the local archdiocesan flag. McDonald’s restaurants fly a familiar Golden Arches flag. The high school I attended celebrates its Barcelonan exchange students with a Catalan flag – but my parents preferred to think of it as the similar-looking South Vietnamese flag.

St. Xavier High School Stadium 
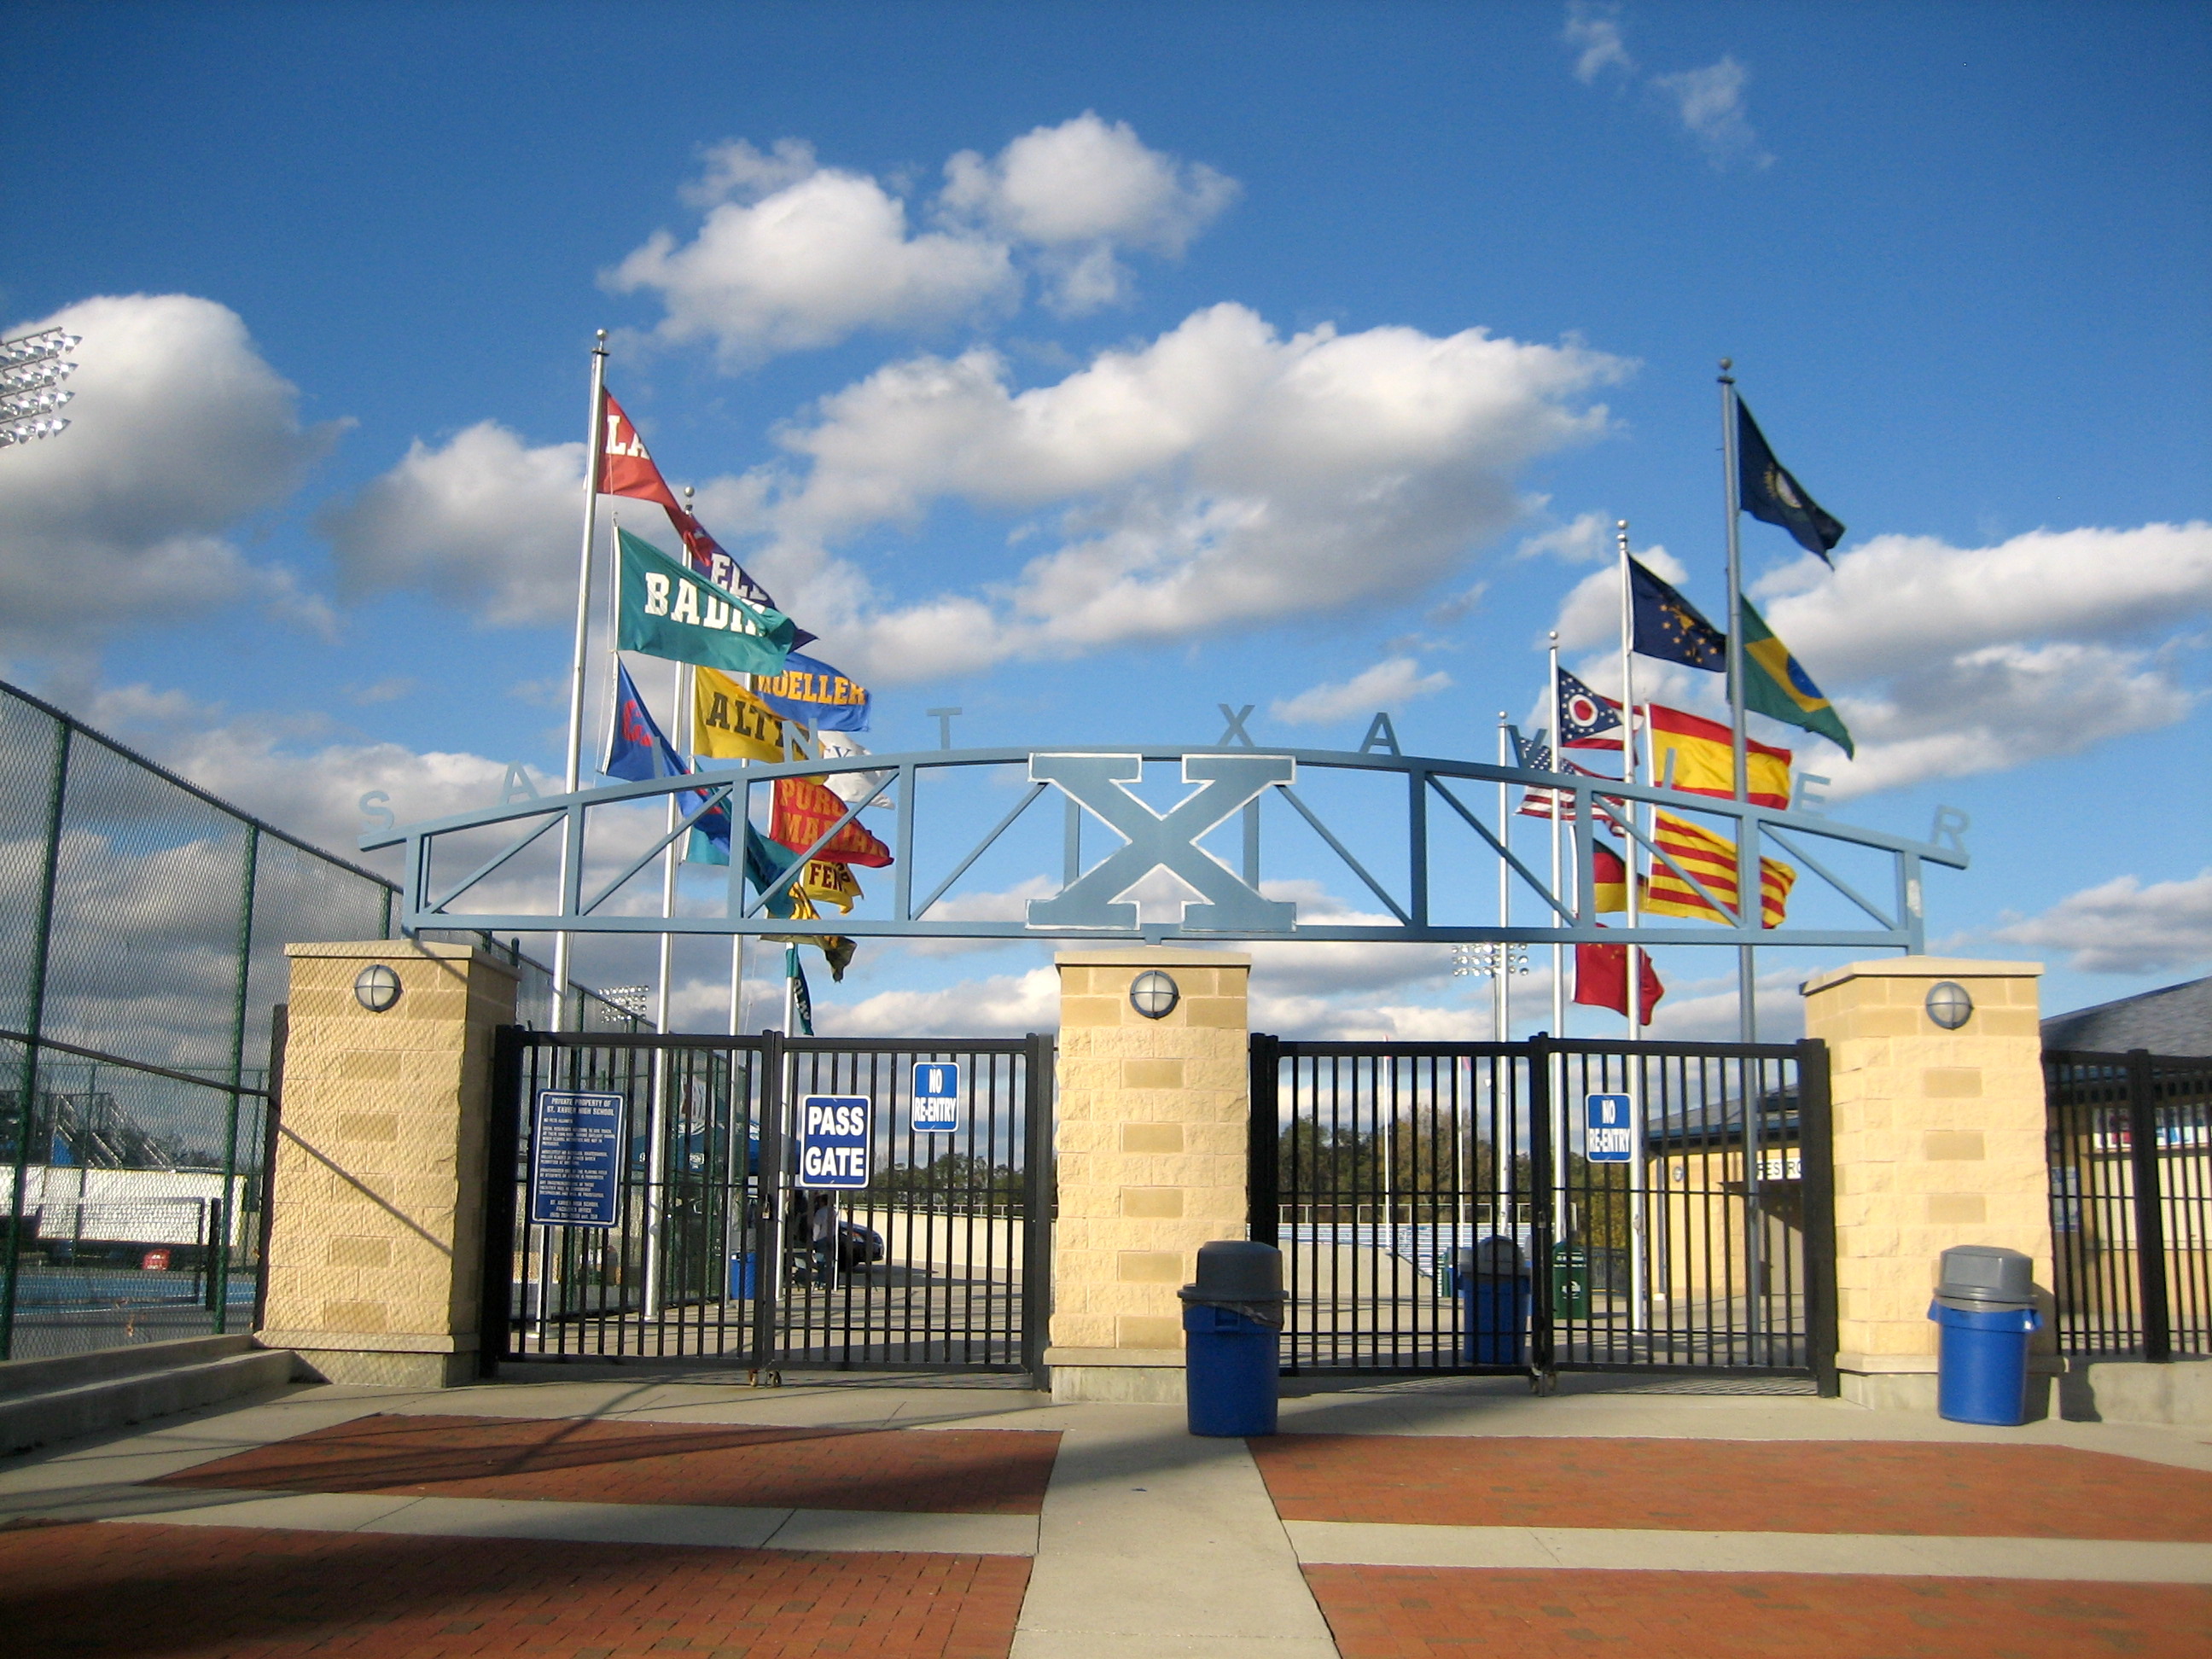
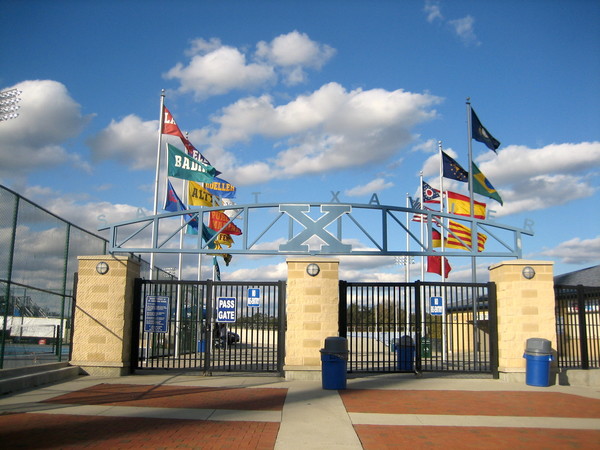
St. Xavier High School in Cincinnati flies the flags of rival athletic teams, the three states where its students live, and the countries that send exchange students. Catalonia’s flag flies under the Spanish flag because of the school’s longstanding partnership with a school in Barcelona. (© Eugene Kim, CC BY)

Probably the main reason no one had ever rigorously catalogued individual South Vietnamese flags is that, important as each one may be to a particular community, it isn’t famous enough that word of that individual flag would usually spread across the country. Armchair mapping offers a way around that, since anyone can comfortably identify flags in street-level imagery and sometimes even aerial imagery. It took me only a few minutes to find South Vietnamese flags in the most well-known Little Saigon, in Garden Grove, California. But apart from that, it’s still time-consuming to think of Vietnamese shopping districts and scour imagery for a little yellow speck to zoom in on. Not nearly every Vietnamese grocery store would fly the South Vietnamese flag, just as not nearly every mainstream grocery store flies the American flag out front.

As a shortcut, I figured that places of worship catering to Vietnamese Americans would be just as likely to fly flags out front as mainstream places of worship, but much more likely to fly the South Vietnamese flag alongside the American flag. OSM has a lot of places of worship in the U.S., thanks to an import of the federal government’s official gazetteer, GNIS. GNIS is by no means comprehensive when it comes to places of worship, and it brought in lots of long-gone churches. Fortunately, it also has a tendency to call Vietnamese places of worship by descriptive names like “Vietnamese Alliance Church” rather than the actual, diacritic-laden names like “Hội Thánh Tin Lành Việt Nam”. So simply searching for “Vietnamese, United States” turned up quite a few churches, many of which do fly the South Vietnamese flag. I made sure to rename these churches according to signs I spotted in street-level imagery, and in some cases I had to move the church quite a distance from where GNIS had it, so there was a practical benefit in addition to the symbolism of getting flags on the map.

Vietnamese Alliance Church of Midway City 
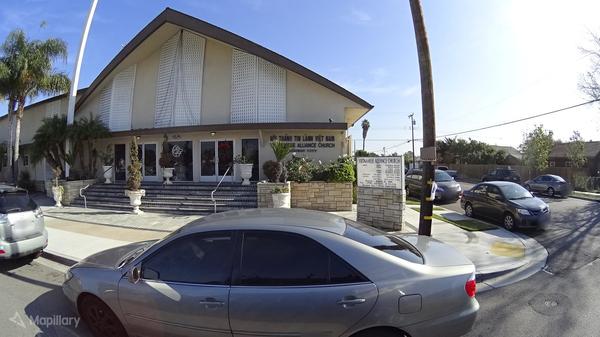
GNIS had this church as “Vietnamese Alliance Church”, but despite subsequent mass bot edits, it had never been tagged as belonging to the Christian and Missionary Alliance denomination. It also hadn’t been tagged with its equally prominent Vietnamese name, though many Protestant churches use the same Vietnamese name anyways. (© Märker Geospatial, CC BY-SA)

I turned up more Catholic churches by searching for the names that Vietnamese Catholics most commonly venerate, but in English: “Vietnamese Martyrs”, “Our Lady of Lavang”, “Andrew Dung Lac”. Aside from flags, these search results gave me a chance to micromap other details like outdoor Stations of the Cross. Similarly, I mapped a lot of statues after searching for Vietnamese words that commonly appear in the names of Buddhist temples, like “Phat” (Phật) and “Quang”.

Vietnamese Martyrs Catholic Church in Arlington, Texas 
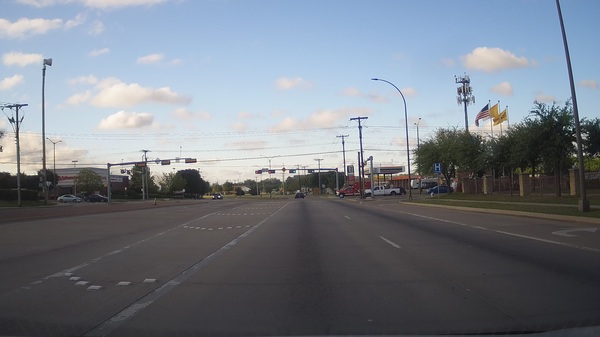
The American, Holy See, and South Vietnamese flags fly outside Vietnamese Martyrs Catholic Church in Arlington, Texas. An outdoor Stations of the Cross is just out of view to the right. By sheer luck, this intersection sports a tornado siren – another hidden map feature I’ve been focusing on. (© Kevin Ewing, CC BY-SA)

I was pleasantly surprised to have access to street-level imagery in most of the localities where I found places of worship to map. That made it much easier to map unfurled flags. Sometimes, though, I had to resort to process of elimination. For example, sometimes the street-level imagery was taken at a time of day when the flags were down, but there was enough of a breeze to unfurl the flags in aerial imagery. From a set of three flags outside a Catholic church, I could often deduce that the one with a dark canton was the American flag, the yellow one was the South Vietnamese flag, and the yellow and white one was the flag of the Holy See. I made sure to tag any other flag I saw along the way, creating a corresponding Wikidata item if necessary.

Ultimately, thanks in large part to Nominatim, I managed to map more than 45 South Vietnamese yellow flags across the U.S. and Canada, making it one of the most commonly tagged flag designs in OSM. (I did spot a couple red flags too, but notably none in the U.S. other than the one outside the U.N. headquarters in New York.) flag:wikidata is now one of the most commonly used Wikidata-related keys in OSM, more common than artist:wikidata and architect:wikidata, identifying Pride flags, Confederate flags, and everything in between.

South Vietnamese flags in OpenStreetMap 
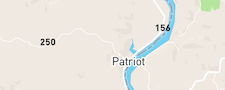
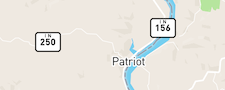
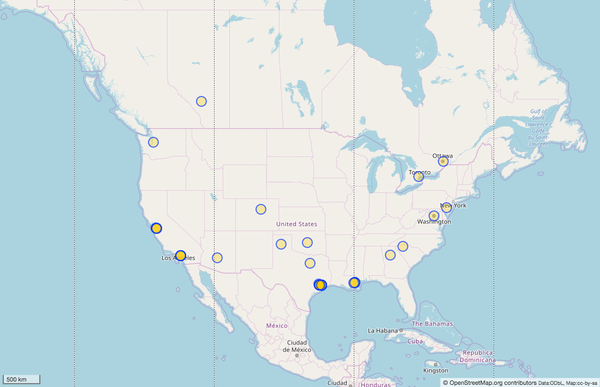
(Run the query) It’s no surprise that Houston and Orange County in Southern California are so bedecked with yellow flags, given the very large Vietnamese populations in both areas. But they show up in some unexpected places too, like Greer, South Carolina, and Sundre, Alberta. OSM doesn’t record the stories behind these flags, but it could serve as a starting point for research. (© OpenStreetMap contributors, CC BY-SA; map data © OpenStreetMap contributors, ODbL)

I look forward to OSM’s coverage of flags increasing dramatically as others find out about this project and scour their own communities for flags. For now, only specialized 3D renderers show flags at all. overpass turbo let us see the invisible flag data, but it requires some training, such as in a walkthrough I gave at State of the Map U.S. last year. As flag coverage increases, I hope renderer developers will take note and add more sophisticated support for this data.

Raising the bar

I’m not mapping South Vietnamese flags in order to bear witness against Communism or to reopen old wounds. Rather, I want to ensure that Vietnamese American communities are represented on the map where they are today, in a way that’s meaningful to them. They already know where to find phở and bánh mì; what matters more is awareness and recognition. I want OSM’s attention to detail to bring people into the project from a broader range of backgrounds. The OSM community needs more diversity – not only among mappers and developers, but also among users and advocates – to establish the project’s relevance in society and keep it sustainable over the long term.

We need to expand our ideas of what OSM can excel at. Flag data is superfluous – until it represents new knowledge about the world that has never been expressed before or leads to improvements to the surrounding map. If we allow OSM to be judged solely by how well we provide the kind of information that people expect out of proprietary maps, OSM’s legacy will at best be a later, less efficient, less integrated Google Maps, merely a more current, detailed imitation of the paper maps in my collection. To be sure, roads, buildings, and businesses are an important baseline for a layperson’s trust in a map, but a baseline alone doesn’t capture people’s imaginations and spur them to action. Let OSM’s corporate infantry figure out how the project can compete with proprietary data sets on baseline data, while we grassroots mappers focus on mapping something quirkier, something more colorful that gets the next generation hooked on maps.

You can help

To map a flagpole in iD, add a Point and search the feature types for flagpole in the sidebar. The built-in fields so far only let you indicate the flag’s type (flag:type) and ISO country code (country), but you can add the flag:name and flag:wikidata keys manually in the “All tags” section at the bottom of the sidebar. The wiki’s flagpole documentation explains some of the nuances, like the difference between governmental and organisation, and how to find or create a QID in Wikidata. But don’t stop there: think creatively about what else might be important to a community’s identity and find ways to represent that on the map too.

Location: Little Saigon, San Jose, Santa Clara County, California, 95116, United States

If you’re organizing an OpenStreetMap-related event, consider adding it to the wiki’s global OSM event calendar, which also appears in each issue of weeklyOSM. Even if you don’t expect to attract new attendees via the event calendar, it’s a decent way to raise awareness of your local community within the broader OSM community.

To add an event to the calendar, go to the Main Page and click the little blue ✏️ link at the top of the calendar. Follow the instructions on the edit page and click “Save changes”. Note that editing the calendar requires a free wiki account with a confirmed e-mail address. Otherwise it’d be too easy for spam to get in.

(If you’re organizing a regularly recurring event for a local community, you should also advertise it in the community index that appears after uploading a changeset in iD.)

Same great taste with half the punctuation

The event calendar has been rewritten to make it easier for non-programmers to contribute new events. In the past, adding an event to the wiki’s event calendar meant editing delicate HTML microformats and idiosyncratic templates. But more realistically, it meant copy-pasting an existing event and hoping for the best. Now a single template handles the implementation details for you, so you can focus on the details that matter.

Before:

|-class="h-event"
| {{Cal|pizza}} || {{Dm|y=2019|Feb 7}} || <span class="p-name">[//www.meetup.com/Code-for-San-Jose/events/256761257/ Civic Hack Night & Map Night], [[San José, California|San José]], [[California]], [[United States]]</span> {{SmallFlag|USA}} {{SmallFlag|California}}

After:

{{Calendar/event
| type = pizza
| date = 2019-07-11
| name = Civic Hack Night & Map Night
| url = //www.meetup.com/Code-for-San-Jose/events/261576831/
| city = San José
| citylink = San José, California
| region = California
| country = United States
}}

On the surface, it’s just a small change – but hopefully one less thing to stress out about as you organize the event. As a bonus, the calendar takes significantly less time to load compared to the old implementation, which makes a big difference when viewing the Main Page.

Under the hood, getting to this point required writing a new template that retained full compatibility with weeklyOSM’s calendar parser, which had been optimized for the old syntax. It was also an opportunity to eliminate options that unnecessarily complicated the code or editing experience, such as unused support for event coordinates and Dzongkha date formatting. (Also, the German city shields are gone. 😬)

Looking ahead, there are more ideas on the table for making it easier to manage the calendar. Further improvements to the wiki’s page load performance are also in the works.

Thanks to everyone who provided feedback and reported bugs as the new template was being developed. If you run into any difficulties contributing to the calendar, please provide feedback on the calendar’s talk page.

Location: Seward, Minneapolis, Hennepin County, Minnesota, 55454, United States

I’m running in the upcoming election to fill an open seat on the OpenStreetMap U.S. board. I’ve been contributing to the OpenStreetMap project as a volunteer since April 2008, mostly by armchair mapping, shoe-leather mapping, and fiddling with the wiki, where I recently became an administrator. I’ve also done a bit of importing and as much evangelization as the folks around me will bear. (My day job, writing iOS software at Mapbox, also intersects with OSM to some extent.)

OSM has the potential to be profoundly more than a tech project. When we see someone lavishly micromapping their neighborhood, we can rejoice that we’ve given them and their community a voice, that OSM has broken new ground, that we’re chipping away at an ancient, one-size-fits-all, top-down approach to mapping the world. We’re incredibly lucky that many people have discovered our project and figured out how to contribute. Just imagine how many more people will discover us once we figure out how to speak to their interests.

As a board member for 2019, I’d like to work with other board members and the newly appointed executive director to:

  • Stay in touch with OSMUS members. The recent town hall and virtual mappy hour felt like long-awaited reunions. I’m glad for that, but we should hold more of these meetings and get more people to show up beyond the mailing list and Slack regulars.
  • Develop resources to help community members plan and execute imports of public-sector data. Besides navigating the import process, mappers need help identifying datasets and approaching data owners with confidence. Lowering these barriers can help ensure that what we end up importing is the best data available.
  • Promote the use of OSMUS server resources for tools that benefit U.S. mappers and outreach efforts. What would a U.S.-centric renderer look like? What tools would be more useful in your day-to-day mapping if we had U.S.-specific versions of them?
  • Forge closer relationships with other free-culture and civic groups, including Wikimedia and Code for America. These communities already have the kind of distributed infrastructure that we imagine when we talk about OSMUS doing local outreach. Local wiki and civic hacking groups are already aware of OSM but may not be aware of the ways OSM can complement their message and power their projects.

This is the first time I’ve run for a leadership position in the OSM community. I’m jumping into this election knowing that I have a lot to learn, but hopefully also some unique perspective to share with OSMUS at this special time in the organization’s history.

We’re lucky that we have too many well-qualified candidates to choose from for this one open seat. 😄 I encourage you to read all of our position statements and cast your vote by Sunday, April 7. See you on the other side!

Location: Farmington Hills, Oakland County, Michigan, United States

Oldenburg

Posted by Minh Nguyen on 2 January 2019 in English.

Oldenburg is a small town in southeastern Indiana, not far from where I grew up, where German is in some respects the official language. The town is proud of its German heritage. If you rely on a proprietary map for directions from Batesville to Metamora, you’ll probably miss a right turn at Oldenburg, which posts street names in German and only begrudgingly in English.

I don’t speak a lick of German, but when I found out that most of Oldenburg is included in a federally designated historic district, the town promised to be a good time sink. What better way to poke at a moat than to make a detailed 3D map of this Old World town, replete with German street names?

OSM versus Google Maps versus Apple Maps

To be included in the National Register of Historic Places, a building needs to be described in a publicly accessible nomination form. In the case of Oldenburg, that means nearly every freestanding structure in town, plus a patch or two of sidewalk, is given a full historical and architectural treatment. The document includes building names (typically after the original owner), floor counts, roof shapes, construction materials, and plenty of details we don’t have established tags for yet.

(Like many NRHP submissions, the one for Oldenburg is in the public domain because it was first published before 1989 without a copyright notice or registration.)

There’s still some work left to do: at least one 3D renderer, F4 Map, randomizes attributes like building heights and tree leaf type when you leave those details out, and there are still a few streets whose German names I couldn’t ascertain (while trying to avoid copying out of Google Street View). Hopefully this post will inspire a mapper in Cincinnati, Indianapolis, or Louisville to make a pilgrimage to this former monastery town for some proper field surveying.

There are thousands of historic districts on the NRHP all across the U.S., and not all of them require translation into English. What other historically significant places await your micromapping skills?

(Photo of Oldenburg skyline © 2016 Chris Flook, CC BY-SA)

Location: 39.341, -85.204

duration=P10Y1D

Posted by Minh Nguyen on 9 April 2018 in English.

This OpenStreetMap account celebrated its tenth birthday yesterday. (Happy birthday, OSM Account!)

Over the last decade, contributing to OSM has:

  1. helped me cope with homesickness
  2. given me too many good reasons to procrastinate on schoolwork
  3. led me to old friends
  4. led me to new friends
  5. taken my inner roadgeek to a new level
  6. taught me more about geography and GIS than I’d ever learn from a book
  7. made me a worse driver (but a better notetaker)
  8. helped me land a job
  9. given my open source contributions a purpose beyond attribution
  10. kept me from forgetting where I come from

Thank you, OSM community, for welcoming my contributions in the first place and for making my stay here as rewarding and meaningful as it has been. Here’s to countless more changesets, mailing list posts, wiki edits, and pull requests!

A cow made of corn

Posted by Minh Nguyen on 20 September 2017 in English.

It’s corn maze season in North America: for a couple months, farms all over are inviting folks to explore mazes they’ve cut out of corn fields.

CVNP A corn maze in Northeast Ohio by David Fulmer, CC BY 2.0.

In OpenStreetMap, several corn mazes have been micromapped across Southwest Ohio. The designs change each fall, so the mazes have to be micromapped all over again.

Wendel Farms pumpkins 
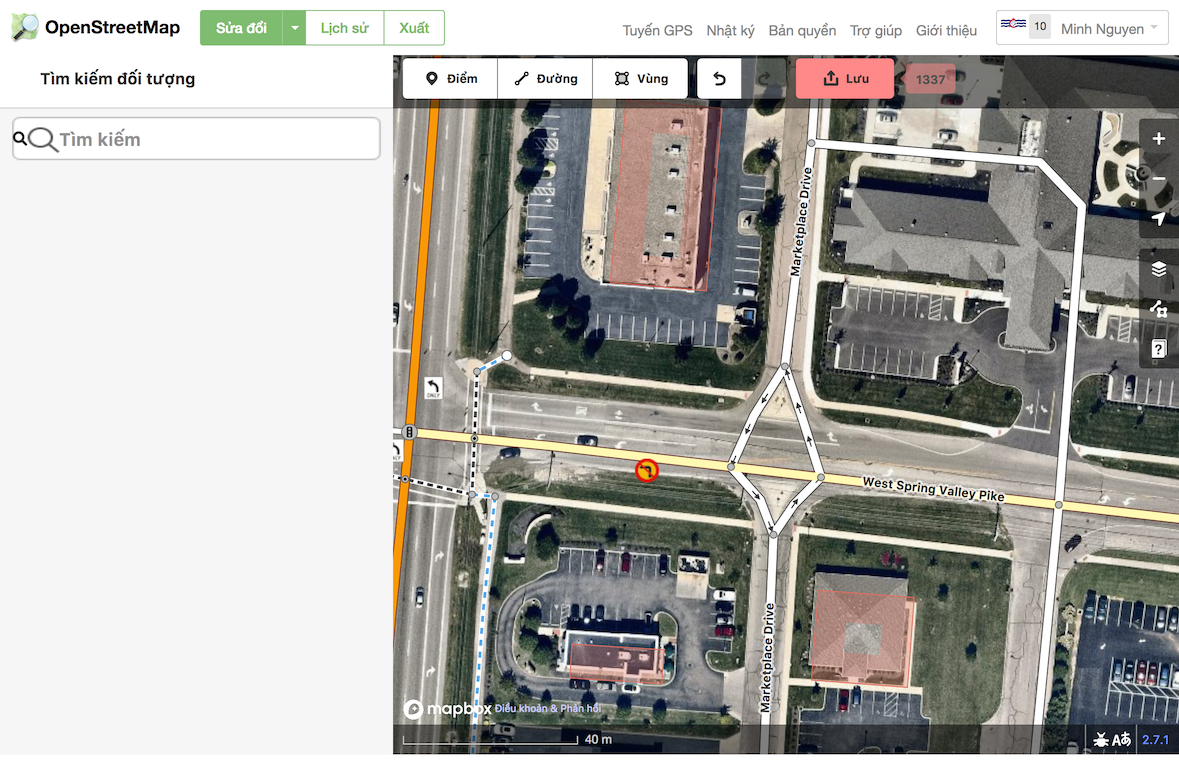
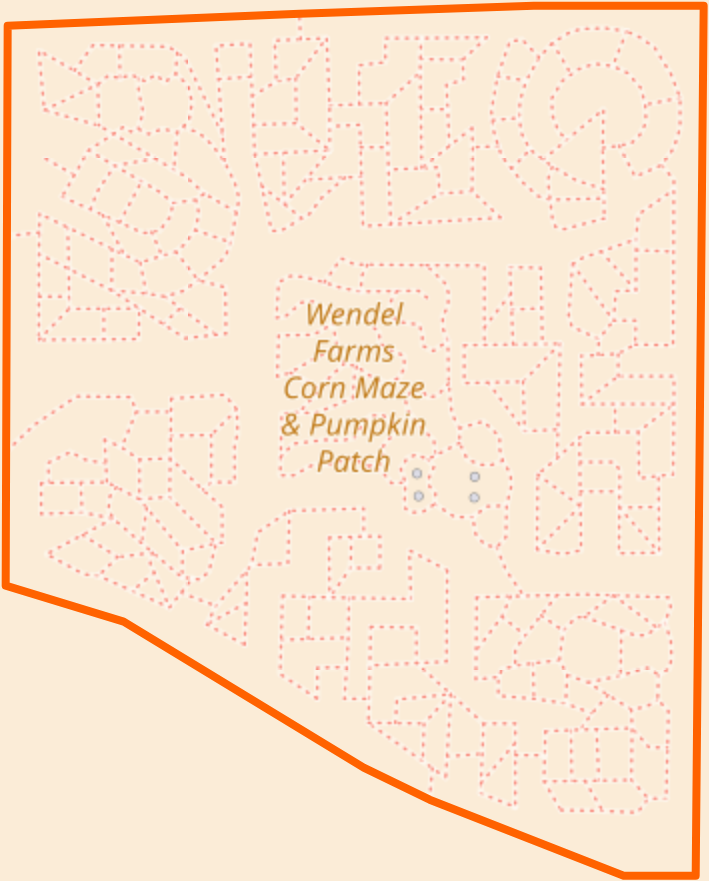
Look sideways: these pumpkins at Wendel Farms were previously visible in Bing and other aerial imagery, but the ways clearly need to be deleted now that the pumpkin design has been cut down (and replaced).

None of the aerial imagery providers have this fall’s maze designs yet – after all, these doodles are only weeks old in some cases. So I turned to the farms’ websites and Facebook pages, where farmers have posted aerial photos of their own mazes. I wrote to them, briefly describing OpenStreetMap and asking permission to update the map based on their photos. A few got back to me, happily giving permission. It’s free publicity for them, after all.

Wendel Farms cow This year, Wendel Farms’s corn maze depicts a cow surrounded by various dairy products.

Since my preferred editor, iD, currently lacks support for overlaying arbitrary images, I built a copy locally and modified it to display the photo above the normal imagery and below the data. Using my browser’s Web inspector, I added a pattern to the SVG document’s <defs> element:

<pattern patternUnits="userSpaceOnUse" id="maze" width="956" height="1174">
    <image x="0" width="956" height="1174" href="dist/img/pattern/maze.jpg" y="200" />
</pattern>

and overrode the CSS style of the <path> element representing the edges of the field:

.area-fill > .w107158117 {
    fill: url("#maze") !important;
}

I probably could’ve done something more sophisticated to keep the image anchored while panning and zooming, but this was good enough for a quick, informal micromapping project.

Wendel Farms cow

Not too long from now, these corn mazes will’ve been cut down and plowed under, and the paths will also be deleted from OpenStreetMap in anticipation of next year’s corn maze season. But a snapshot of this fall’s designs will eventually appear in the standard aerial imagery and remain there for years to come. As a result, mappers can compare a corn maze’s appearance and the date on which the maze was micromapped to determine the vintage of the surrounding area’s imagery.

In the meantime, if you poke around Southwest Ohio, be on the lookout for cows and other scenes hidden among the cornstalks.

Location: Reily Township, Butler County, Ohio, United States

Finding Wilson Boulevard

Posted by Minh Nguyen on 22 May 2017 in English.

(This post is cross-posted from a recent post on my blog and adapted for an audience already familiar with OpenStreetMap.)

An overflowing bánh mì, a tray of tender bánh da lợn, a can of soybean milk: my treat after every monthly trip to the little Vietnamese grocery across town. Mekong Market was my Sunday Bible school of Vietnamese culture in a childhood as distant from Asia as one could imagine, in Cincinnati. Snacks, sauces, and canned foods defying translation lined the shelves; in the refrigerator, a variety of mystery meats wrapped in aluminum foil each bore the same place of origin: Chicago.

One Labor Day, my family made a trip up to Chicago to finally see the bustling Vietnamese community whose clearance we had happily bought for years. We made a lot of road trips back then, often just spur-of-the-moment driving through the peaceful countryside. But since we were headed five hours away to an unfamiliar city, we needed to plan ahead. As the resident map enthusiast, I was to find directions to the Vietnamese supermarket in Chicago using our new Internet connection. We’d enjoy some phở for lunch and bring back enough fresh ingredients to avoid Mekong Market for a little while.

A search for “Vietnamese markets in Chicago” on AltaVista turned up an article from The Washingtonian describing a cluster of supermarkets, phở restaurants, and bakeries on Wilson Boulevard. I pasted the street address into MapQuest, specified “Chicago” and “Illinois” to make sure I got the right “Wilson”, and printed out the directions.

Bánh mì thịt nguội
A Vietnamese cold cuts sandwich (bánh mì thịt nguội).

Five hours later, we arrived in Chicago and crawled up and down Wilson Avenue. If a Vietnamese supermarket or two were to be found along this street, it couldn’t have fit very easily inside any of the modest townhouses that lined the street from end to end without interruption. I noticed, too, that the entire length of the street was numbered in the 8000 range, as opposed to the 6700 block on which this supermarket supposedly stood. My father pulled the car aside and called the supermarket’s phone number on his cell phone. I could understand just enough Vietnamese to make out the voice on the other end: “I’m in Northern Virginia – what in the world do you want me to do for you?”

As my father held his tongue – Grandma was in the back seat – we wandered aimlessly around that part of town until we happened to spot some Vietnamese signage. There, just a few minutes away from Wilson Avenue, were the supermarket, phở restaurant, and bakery we had been hoping for, by sheer luck.


In the years since, I moved to San José, California, home to one of the largest populations of Vietnamese Americans in the country. Bánh mì shops here are as commonplace as cafés. In fact, the only reason I ever notice them is that I also became immersed in OSM. I found a niche mapping “flyover country” and made it my mission to improve coverage of communities underserved by commercial map vendors, among them ethnic enclaves in San José, Orange County, and elsewhere.

Last month, I happened to be in Washington, D.C., visiting my employer Mapbox at the new office there. On a lark, I decided to spend Sunday afternoon visiting Wilson Boulevard for real. It had been almost eighteen years since my last attempt, but despite having since moved to a city with a large Vietnamese population and plenty of Vietnamese food, I figured seeing this street in person would give me some closure. Fortunately, the same Metro line that took me almost to the airport also took me almost to Eden Center, the Vietnamese shopping center that had teased me back in grade school.

Parking aisles
No Vietnamese shopping center would be complete without a kitschy gate.

I had always imagined Eden Center to be more of a bazaar than a strip mall. Nonetheless, it has almost everything you’d expect from a center of Vietnamese social life: a dearth of parking, a man singing karaoke to an impromptu crowd out front, a father treating his daughters to the kumquats that hang from a decorative tree nearby. On the other hand, there are no elderly men playing cờ tướng in front of the shops, as one often finds in California. (One wall bears an enormous warning against gambling and suggests area casinos as alternatives.)

Like similar centers in Orange County, Eden Center is steeped in war history. Each aisle in the parking lot bears the name of a South Vietnamese general.

Parking aisles
At the intersection of Nguyễn Khoa Nam and Trần Văn Bá “Avenues”.

The South Vietnamese flag flies proudly beside the American flag. As it was the week before the anniversary of the Fall of Saigon, a banner spanning the two flagpoles honored South Vietnamese war heroes.

South Vietnamese heroes banner
The banner reads, “With Gratitude We Revere the Martyred National Heroes of the Republic of Vietnam”.

I thoroughly field-surveyed Eden Center, noting the restaurants, jewelers, beauty salons, travel agencies, and karaoke bars tucked away in the center’s “mini-malls”. Before leaving, I bought a bánh mì, a piping hot tray of bánh da lợn, and a can of soybean milk for the road.


The whole reason I got involved with “citizen mapping” is that proprietary map sources fall so short when it comes to places beyond San Francisco, beyond the central business districts, beyond the tourist traps.

Eden Center on Apple Maps
Apple Maps includes only a few shops, but they’re all in the wrong places and some are no longer open.

Eden Center on Google Maps
With the same indoor mapping style it applies to every mall, Google Maps makes it look like it has spectacular coverage of Eden Center. But it’s just walls: most of the shops are still in the wrong location and some have closed.

Eden Center on Baidu Maps
I found it surprising that Baidu Maps has coverage of this area on par with Apple Maps, but it too has misplaced and outdated points of interest.

OSM didn’t have a lot of detail about Eden Center until I ventured there last month, but now it’s complete, accurate, and up-to-date. Even the parking aisles are named. It’s looking a lot better than the competition.

Eden Center on OSM, before and after
After my visit to Eden Center, OSM gained so much detail in the area that there isn’t enough room to display most of the points of interest with proper icons and labels. (Left: before; right: after)

Eden mini-malls on OSM, before and after
(Top: before; bottom: after)

Eden Mini Mall on OSM, full detail
One of the advantages of a human-curated map database is an at-times quirky attention to detail. The abundance of diacritical marks in Vietnamese are essential to comprehension, so this Vietnamese-American community will find it helpful that OSM includes the diacritics, even though this shopping center is located in a predominantly English-speaking city. Maybe someday the highway=corridor ways will be useful for pedestrian routing, too.

OSM may have a long way to go before it can even dream of breaking people’s Google habits. I’m under no illusions about how poorly it scales to visit each site in person via public transportation. But for now, I’m just happy to have finally made it to Wilson Boulevard and made it easier for others to do the same – minus the detour.

Location: Falls Church, Virginia, 22046, United States

Highway shields, state by state

Posted by Minh Nguyen on 25 July 2016 in English. Last updated on 22 July 2022.

With State of the Map U.S. still fresh on everyone’s mind, let’s revisit a favorite topic among many U.S. mappers: highway shields. We’ve been talking about ways to improve the sorry state of route shield support across the OSM ecosystem since at least 2011. We haven’t yet reached the vision outlined by Richard Weait in that SotM talk, but things aren’t as bleak as the osm.org renderers may let on.

In America, things are complicated

The national standard for U.S. state route markers is black numerals in a white oval. But almost every state eschews this oval in favor of its own design. (Some states have several, depending on the type of road.)


State highway shields by state (Chris-T)

In most states, the marker consists of a number in a distinctive shape, possibly with color:

K-10
Kansas state highways, such as K-10, are indicated on signage by a yellow sunflower, the state’s official flower. (Steve Alpert)

By adopting these various designs, maps can optimize usability for motorists. While driving, one should be able to compare the route shield the navigation application is displaying with guide signage up ahead, without having to know the ins and outs of the local road network. Getting the iconography correct is important because the same route number on a different shape may lead you in a different direction.

SR 562
Ohio state highways, such as SR 562, are indicated by the state’s simplified shape. (allen, CC BY-SA 4.0)

Regular expressions to the rescue?

Unlike most OSM-based maps, the recently departed MapQuest Open layer included different route shield designs for each state. But it relied on a fragile assumption that the way’s ref tag had to begin with the state’s postal abbreviation, e.g. ref=KS 10 in the example above. Parsing a way’s ref tag is suboptimal for various reasons:

  • There are known conflicts with other countries and other countries’ political subdivisions. For example, ref=CA… occurs in both California and the Cantabria region in Spain. ref=NH… occurs both in New Hampshire and throughout India.
  • Some states have multiple statewide route networks. Texas famously uses 12 distinct shield designs for state-level routes, and several of these networks overlap numerically. The postal abbreviation isn’t enough to distinguish one network from another.
  • Many states have county, township, or even city routes with distinct markers. In Ohio, each county has its own design, and within many of those counties, there are a variety of township route marker designs. A generic prefix like CR or TR is insufficient for selecting a suitable marker image, yet fully qualifying the jurisdiction on every way (ref=US:OH:MRW:SouthBloomfield 190) would also be tedious and error-prone.

In some states, the highway department doesn’t use the state’s postal abbreviation when abbreviating route numbers, nor do most residents in writing:


Ohio uses “SR” on variable message boards where a pictograph would be infeasible. (ODOT)

In Ohio, the consensus has been to tag ways with the “SR” prefix and rely on route relations for disambiguation. Some other states have similar practices. Unfortunately, this approach caused the state’s routes to be marked with the generic oval instead of the state’s shape. MapQuest Open is no longer available on osm.org, but the need to choose state-specific shields remains common among renderers.

For years, members of the U.S. OSM community have promoted an alternative, more flexible tagging scheme for highway routes: the ref and network tags on route relations. In 2013, Phil Gold developed an experimental “shield renderer” to demonstrate how a renderer might make use of this data:

Shields
The OSMUS shield renderer supports a variety of shield designs as well as route concurrencies.

But making use of route relations is a difficult problem for production-level consumers of OSM data, so parsing ways’ ref tags remains the most common approach to selecting route shields, despite the disadvantages above.


“Perl Problems”, xkcd (Randall Munroe)

A baby step using spatial queries

When I’m not mapping speed bumps and backyard swimming pools for fun, I work at Mapbox on the open-source Mapbox iOS SDK and the Mapbox GL renderer that powers it. Mapbox GL renders Mapbox Streets vector tiles, applying a stylesheet designed in Mapbox Studio.

The style language used by these tools doesn’t yet support regular expressions, so the vector tiles can’t include the raw way refs for the renderer to parse. Instead, when an OSM way is baked into a vector tile, a spatial query determines the relevant ISO 3166-2 code (the country code plus the postal abbreviation), which goes into an iso_3166_2 field.

This field makes it possible for anyone to create a map that includes state-specific route shields. To prove it, I used Studio to create a custom style, Interstate, based on the default Streets style:

tri-state-refs
With a regular expression–based filter, a conventional renderer would be unable to distinguish between Ohio and Indiana state route refs.

I wanted to get back to armchair mapping, so I only customized the shields for Ohio, Kentucky, and Indiana rather crudely. But with a bit of effort and more graphics design chops than I possess, the other states could receive similar treatment.

Note that this is only a stopgap solution to the problem of choosing state-specific shields: Mapbox GL doesn’t support grouped icons for route concurrencies yet, and ISO 3166-2 codes don’t identify counties, townships, or the myriad route networks in Texas. But it’s still better than seeing homogeneous white ovals everywhere.

Build your own Interstate

It takes a certain amount of roadgeekery to care about state-specific route shields on a map, but it doesn’t take any programming skills to design and publish a style like Interstate:

  1. Sign up for a free Mapbox account and open Studio.
  2. Click New Style and choose a template. (Other than Satellite and Empty, each of the templates is based on the Mapbox Streets source and thus OSM data.) For this style, I chose the Streets template: Templates
  3. Zoom the map in to level 10 or beyond and center it somewhere in the U.S., so that the generic oval state route shields are visible.
  4. The left sidebar lists the style’s layers, which are akin to layers in a vector graphics tool like Inkscape or Adobe Illustrator. Expand the “Highway shields” folder. Layers
  5. Two layers of interest are “road-shields-white” and “road-shields-black”. The former is for shields that have white text, such as for Interstate highways and California state highways, while the latter is for shields that have black text, including most states’ highway shields. For this style, select “road-shields-black”. (You can also click on the roads on the map to select these layers.)
  6. In the flyout for this layer, switch to the Icon tab and note that the Image property is set to {shield}-{reflen}. Mapbox GL fills in the shield and reflen tokens so that a three-digit state route gets the us-state-3 shield. Now switch to the “Select data” tab. The lengthy filter ensures that the layer doesn’t rope in any roads whose shields should have white text. The map highlights the ways that remain. These are the state routes you want to style. The filters beforehand Data on the map
  7. At the top of the layer list, click the Duplicate button and name the new layer “road-shields-state-black”. Duplicate
  8. In the new layer’s “Select data” tab, delete the existing shield filter. Replace it with one that includes a shield that “is any of” us-state. Then add another filter for an iso_3166_2 that “is any of” US-OH, US-KY, or US-IN. The resulting filters
  9. Back in the Style tab, in the Icon tab, change {shield}-{reflen} to {shield}-{reflen}-{iso_3166_2}. You’ll be adding icons with names like us-state-3-US-OH. (Alternatively, you could create a separate layer for each state, but more layers means more maintenance overhead and possibly worse performance.)
  10. Uh-oh: where previously there were generic state route shields on the map, now there are only numbers. Missing shields Click the “{}” button on this text field to open the icon manager flyout. The style already has a lot of icons, including highway shields for many countries. Icon manager flyout Click the “Add SVG Images” button and upload a roughly 20×20 SVG image for each state-reflen combination you want to support. If you’re looking for inspiration, here are some existing SVG route shield sets that you could adapt in Inkscape or Adobe Illustrator (MUTCD-compliant iconography is in the public domain, but note that some designs may be trademarked):
    • Shield templates from the 2013 shield renderer – Remove the text span from each image before use. Mapbox GL will superimpose the route number onto the shield. You can customize the number’s styling in Studio.
    • Shield blanks from Wikimedia Commons – You may want to remove the black background from many of these images. The black background improves visibility for reassurance markers, but it’s unnecessary when the shield is merely a “sticker” on a map.
    • Some crude images I made based on a few of the Wikimedia Commons images above
  11. After uploading the images, you should see them in the flyout, and the map should now show state-specific shields. Uploaded icons Shields fixed Finally, click the Publish button at the top of the left sidebar to make your changes public.

As seen on TV

I encourage you to check out Interstate. The map starts out at the Ohio-Kentucky-Indiana tripoint, so you can see the special style rules in action. Unlike the 2013 shield renderer, Interstate is the real deal: it’s served from production servers, ready to be embedded in a Web, desktop, or mobile application. (But please create your own copy using the instructions above instead of hotlinking this demonstration style.)

iOS
An example of what an iOS navigation application would look like using the Interstate style, the Mapbox iOS SDK, and the OSRM-powered Mapbox Directions API.

It’s worth noting that the ref tag isn’t just for renderers: OSRM includes the ref of each way along the route, so that a turn-by-turn navigation application can announce “Turn left onto SR 4.” If locals don’t refer to the highway as “OH 4”, neither should the voice announcement.

The ISO 3166-2 codes exposed by Mapbox Streets partly decouple the ref tag’s format from the visual output. This frees up the ref tag to reflect the notation that’s used by humans and verifiable “on the ground”, rather than some arbitrary standard enforced for the benefit of renderers. The sooner we wean renderers off their dependence on specific ref tag patterns, the sooner we can expect renderers to support route relations. I can’t wait for that day to arrive.